
- Overview
- Toolkit Overview
- Introduction to Data Viz
- Resources
- General Considerations
- Accessibility
- Color
- Caution: Read the Terms of Use
- Types of Visualizations
- Charts
- Dashboards
- Data tables
- Infographics
- Maps
- Qualitative
- Enhancing Engagement
- Animations
- Interactivity
- Presentations

Ground your data with mapping, a quick and powerful way to display summary data or services by location or region. Effective maps can be static and simple, or they can be complex, dynamic, and interactive online objects that enable comparisons of service providers, schools, programs, performance metrics, and demographics.
Maps Design Principles
- Constrain your data to your users’ needs. It’s easy to provide a wealth of information in a single map, but the viewer will be overwhelmed if there are too many different data elements to consider in a single view. Decide what data elements matter, and pull only them into the map.
- Zoom in! If the data you want to display occurs in a certain district or region, show it within that district or region, not your entire state, so the viewer doesn’t have to squint.
- Know your message and your audience. If you are displaying one statistic in different locations across a region, a static, simple map highlighting only that relationship in stark colors will make an impact. Don’t obscure it with a dynamic map of numerous variables. On the other hand, if the map is for finding a service provider, school, or program that meets individualized needs, an interactive tool that can be searched or filtered is more appropriate.
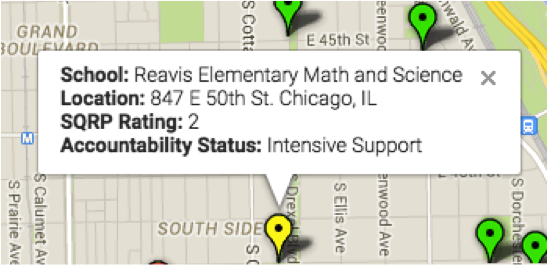
- Data windows allow users to hover over a region or data point to see extra information; the windows should be concise and relevant. Keep your data windows simple.
- It is essential to seek external reviewers in the development and use of data maps to help interpret the geographic and demographic context of the region and to add this context for the viewer as needed. For example, two locations on a map may appear to be close in distance, but terrain or infrastructure may make commuting between them very difficult.
- Consider general and or visualization-specific accessibility tips and principles.
Example: Data Window from Google Maps
Published December 2022.