The resources and tools below are provided as useful examples only. The DaSy Center is not affiliated with, sponsored by, or endorsing any of the listed resources and tools. For guidance on understanding how modern data visualizationsoftware handles data, visit the Caution: Read the Terms of Use section.
Charts Resources
Data Visualization Checklist. This checklist provides detailed guidance on text, arrangement, color, and lines. It is useful to refer to when developing a chart of any type.
Charts Tools
Advanced Statistical Software
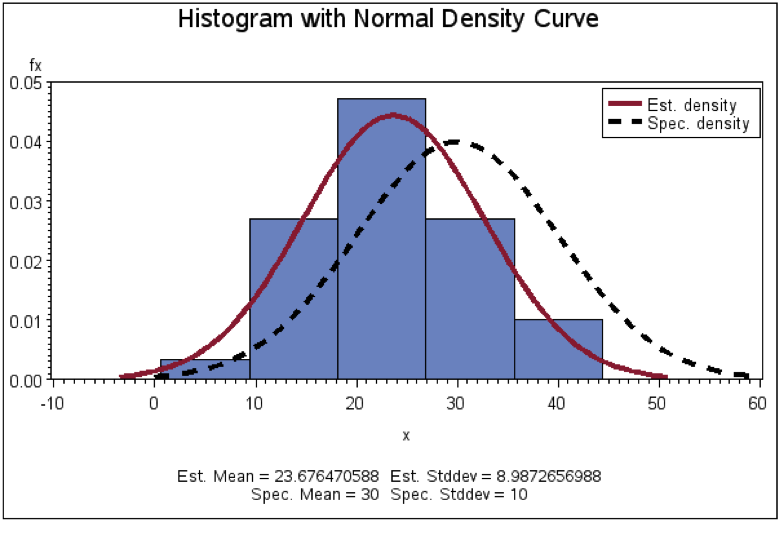
Advanced statistical software such as SAS, SPSS, and Stata are used to manage and analyze large, complex data sets. These programs also have the capability to graph analyses of data using syntax to write programming code or graphical user interfaces to select commands. Advantages of using these programs to create charts are that you do not have to transfer analytic output needed for the chart to another program (like Excel), and you can analyze datasets quickly to get the data needed for charts. Disadvantages are the cost of the programs and the skill needed to use them effectively. This section focuses specifically on SAS.
Skill Level
Advanced
Accessing the Tool
A user license must be purchased directly from SAS. Creating charts requires the add-on SAS/GRAPH, which adds to the cost of the license. SAS has a robust online support system and archive of papers to support users.
General How-To
To understand the basics of data manipulation and analysis, formal training in SAS is necessary either through a college or university or directly through SAS. The SAS Institute provides free tutorials and e-Learning online, as well as in-person courses. See this SAS support paper for information on using SAS/GRAPH. Furthermore, SAS provides a Graphic Samples Output Gallery.
Tips for Creating Effective Displays
Get training! And go to the graphic samples gallery to see examples of graphs and the syntax needed to create them in SAS.
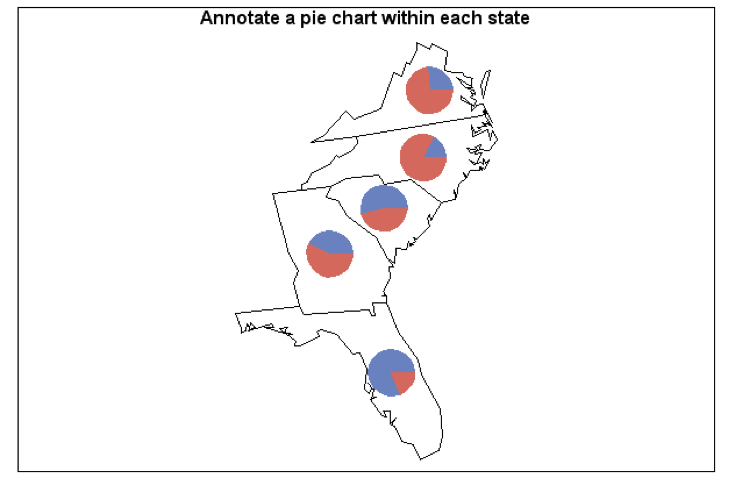
Figure 13: Example of a Special Type of Map Produced Using SAS
Although there are many options, there are limits to the amount of customization you can do to the existing templates and syntax. To change the chart, you have to rerun the entire chart program (syntax) to re-create the chart (i.e., you can’t just click on a chart that’s been produced and modify it directly).
Datawrapper
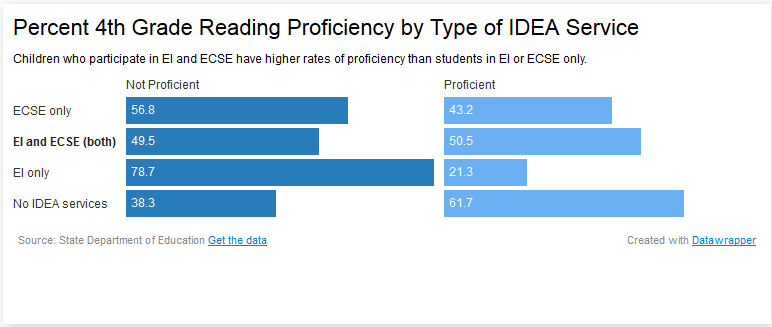
Datawrapper is an online automatic chart-maker. You can upload or copy-paste your own data and Datawrapper will automatically generate and allow you to customize various bar charts, dot plots, circle charts, line charts, and even maps. Figure 12, for example, shows a split bar chart created using Datawrapper. Charts can then be downloaded as images or embedded in websites.
Figure 12: Split Bar Chart Created in Under a Minute Using Datawrapper
Skill Level
Beginner
Accessing the Tool
A free version of Datawrapper is available online. Once you create an account you will have your own Datawrapper dashboard that includes your recent charts, access to the Datawrapper blog, and a host of tutorials. The free version allows you to download the charts you create as PNG files. For a small monthly rate you can upgrade to the ‘Single’ version that allows you to embed the charts you create in your website, and the ‘Team’ version allows you to have multiple accounts that share a dashboard and provides more customizable options.
General How-To
The Datawrapper Introductory Video shows you how to create a chart using Datawrapper in 100 seconds. You can also access Datawrapper Academy which includes short video tutorials for all of the chart and map options in Datawrapper.
Tips for Creating Effective Charts in Excel
Before you copy-paste or upload a csv file to Datawrapper, drill down your data to only what you want to display. One way to do this, is to create a pivot table in Excel to summarize your data and insert only the pivot table data. Alternatively, just insert a table of the summary statistics you want to display. Datawrapper will have a hard time with raw data or large Excel files.
Try out all the different chart options in Datawrapper, but remember the chart design principles. Just because you can chart your data in many different ways doesn’t mean you should. Pick the chart that shows the data clearly and is easy to interpret.
Limitations
Free plans do not allow you to embed your charts online. Additionally, Datawrapper is an online only tool and you should only upload publicly available data.
Excel
Microsoft Excel is one of the most widely used platforms for analyzing and charting data. It’s possible to generate the most common chart types from the raw data in a spreadsheet. Although Excel is somewhat limited in default options, skilled users can create a large variety of effective data visualizations. Also, Microsoft PowerPoint has a limited set of charting options that are based on the Excel platform. You can import an Excel chart into PowerPoint by copying and pasting it as an image. Excel functionality includes real-time collaboration and offline editing. EI and ECSE staff can create pie charts, bar charts, scatterplots, histograms, and more.
Skill Level
Beginner through Advanced
Accessing the Tool
Microsoft Office, including Excel, is a licensed suite of software that requires purchase (Office 2015 or earlier) or a subscription (Office 365).
General How-To
How to Make a Chart in Excel: This step-by-step tutorial for creating a chart in Excel includes a video. This tutorial is for chart newbies or experienced users wanting to brush up on the basics.
Getting stuck? Google it! There are many forums on Excel use, and Microsoft’s tutorials are a good place to start: Office support for Excel
Tips for Creating Effective Charts in Excel
Customize, customize, customize. Update gridlines, labels, axes, and colors to avoid the default look and enhance your chart’s readability.
If you are using a legend, make sure the colors visually align with the chart (e.g., if horizontal bars, put the legend across the bottom). Alternatively, add labels by simply inserting text boxes or color code the words in your title (see Figures 2, 7, and 9) instead of having a legend.
Be an Excel hack! If Excel does not have the chart you want, create it. In addition to the templates linked in the Data Considerations section, see IDEA Data Center’s Show me the Data Webinar Part 2 and associated Excel templates (slope graphs, diverging stacked, dot plot, and more), as well as the Juice Analytics website (bubble graphs, bullet bar graphs, stacked column volume charts, waterfall charts, and more) for easy-to-use Excel hack graph/chart templates.
Limitations
Default chart options in Excel are somewhat limited. There are simple ways to update the charts to meet your needs, but this takes time and know-how.
Flourish
Flourish is a freemium web-based data visualization application focused on interactivity and storytelling. It features a deep library of chart templates not found in most other turnkey data visualization software, including modern chart types like Sankey charts and box plots. EI and ECSE staff can upload their data to create numerous data visualizations without coding and embed them in websites.
ggplot2
ggplot2 is a free, popular open-source data visualization package for the statistical programming language R. As an open-source software, it offers more analytic and creative flexibility and map types than most data visualization tools. However, ggplot2 requires coding experience with R, a popular open-source data science programming language. EI and ECSE data staff can download the tool and create endless custom charts, maps, and other visualizations.
Google Sheets
Sheets is a free web-based spreadsheet application. Its functionality is similar to Excel, although it offers a range of unique tools. Sheets functionality includes real-time collaboration, data exploration through machine learning, and offline editing. EI and ECSE staff can upload their data to create real-time charts, candlestick charts, bar charts, pie charts, scatterplots, histograms, and more.
Infogram
Infogram is a freemium web-based data visualization and infographic tool. EI and ECSE staff can create charts, infographics, dashboards, and maps and embed them in their websites. Infogram also has an extensive library of royalty-free media. Infogram features artificial intelligence to enhance the workflow.
Tableau Public
Tableau is a dynamic tool with many capabilities. Drag and drop data sets and variables into interactive data dashboards, and export your visualizations online or in graphic form. Tableau Public is the free version, which has advanced capabilities but requires that all data be public.
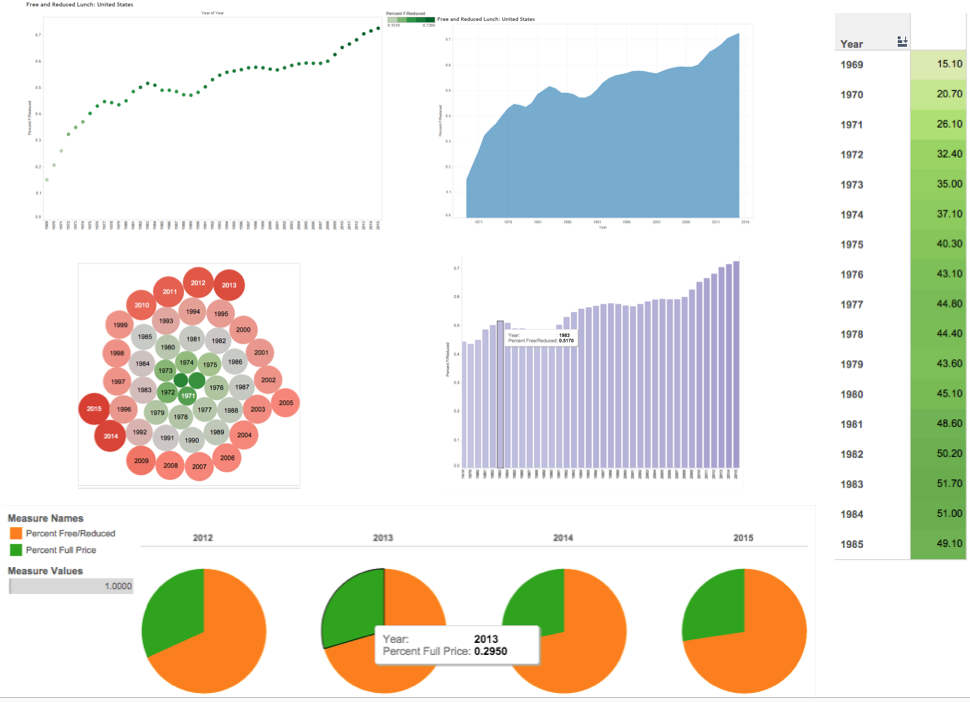
Get comfortable with Tableau’s “shelves” system, a drag-and-drop interface for variables. Moving elements to different shelves can dramatically change the display; experiment until you find a good fit. See figure 9 below for an example of different graphics automatically created from one data source in Tableau.
Tableau has background data layers from census data, such as U.S. population and other demographics, which can be automatically overlaid in any map visual.
Tableau autogenerates categories like “measure names” that can be dragged into the Details shelf to create custom labels.
Experiment with the Color shelf for your data, which includes categorical and gradient features in attractive (and not-Excel!) themes.
Limitations
For the free Tableau Public software, any saved workbooks are available online to the public—so do not use it for confidential data!
For very large data sets or private data services, Tableau requires the purchase of a Tableau plan.
When embedding this application, be aware that applications headings may appear that could be distracting for users.
Figure 11: Same data, six ways in Tableau: Percentage of Students Using Free or Reduced-Price Lunch, 1969-1985
Updated July 2026.
If you require an accommodation to access any DaSy Resource, please contact DaSy.