The George Washington University Library system has an online repository of mapping resources, including examples of interactive maps, GIS data directories, and mapping tools.
Maps are not all the same, and based on their advantages and limitations, some styles of maps are better at representing certain types of information than others. This resource describes 12 common methods for visualizing geospatial data to help you choose the right map for the data you want to illustrate.
Maps Tools
Microsoft Excel
Microsoft Excel is one of the most widely used platforms for analyzing and displaying data. Excel Maps is available free with Excel 2016.
Skill Level
Beginner
Accessing the Tool
Microsoft Office, including Excel, is a licensed suite of software that requires purchase (Office 2015 or earlier) or a subscription (Office 365). To get a free 1-month trial, or purchase a monthly subscription or license, go to https://products.office.com/en-us/try.
<!--If you have Excel 2013 please, follow the instructions to install Power Map (now called 3D Maps) located on the Microsoft site. -->
General How-To
In Excel, open a workbook that has the data you want to map in a table. Note: Your table must have at least one geographic data element per row (such as state, Zip Code, city, county, countries/regions, or longitudes and latitude). This guidance helps you structure your data properly for mapping.
To make a 2-D Map:
Click on any cell in that table.
Select Insert – Maps – Filled Map.
You can format the map and add data labels similarly to how you would edit a chart.
To make a 3-D Map:
Click on any cell in that table.
Select Insert – 3D Maps.
3D Maps uses Bing to geocode your data. After a few moments, the globe will appear next to the first screen of the Layer Pane.
Then, in the Data area, change the visualization to “Region,” and a new field box will appear called “Value.”. Click and drag the variable you wish to map to the “Value” box.
The “+” and “-” magnify and reduce the zoom, and the direction keys pivot the map in 3D.
The number of data points displayed at once is currently limited to 1,000. This is only for the current view of the data. For example, 1,000 data points can be displayed in the U.S. view, 1,000 data points can be displayed for Europe, etc. This also holds when zooming in on particular regions.
Tableau Public
Tableau has many capabilities, and mapping is just one of them. Mapping capabilities include geocoding data, providing preset data layers of known U.S. census data, and creating individual points and polygonal maps. For more general information on Tableau Public, see the Interactive Displays section.
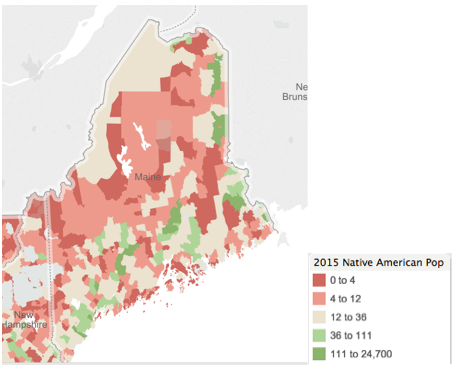
Tableau has background data layers from census data, such as U.S. population and other demographics, which can be automatically overlaid in any map visual (Figure 9).
Switch the display from Automatic to Filled Map if you want areas (like cities) to be colored polygons, not flagged points.
Limitations
For the free Tableau Public software, any saved workbooks are available online — so do not use it for confidential data!
For very large data sets or private data services, Tableau requires purchasing a Tableau Business plan.
When embedding this application, be aware that application headings may appear that could be distracting for users.
Figure 9: Example of Polygon Census Data Overlay, American Indian Population in Maine, 2015
BatchGeo
BatchGeo bills itself as the “fastest way to create Google Maps with your data.” BatchGeo allows you to layer your own data over Google Maps’ mapping resources. The tool has six map styles, with preformatted data window settings and area coloring, but it limits your options for further customization. See examples of BatchGeo maps in action.
Take a look at BatchGeo’s Excel spreadsheet to see an example of how to best set up data for this tool. Once you have data with header rows, copy and paste it into the site’s homepage table. Click Validate and Set Options to verify that BatchGeo has correctly identified the locations. Click Map Now for immediate results.
BatchGeo will email you a link to your map and an embed code for direct integration of the map into a webpage.
Tips for Creating Effective Displays
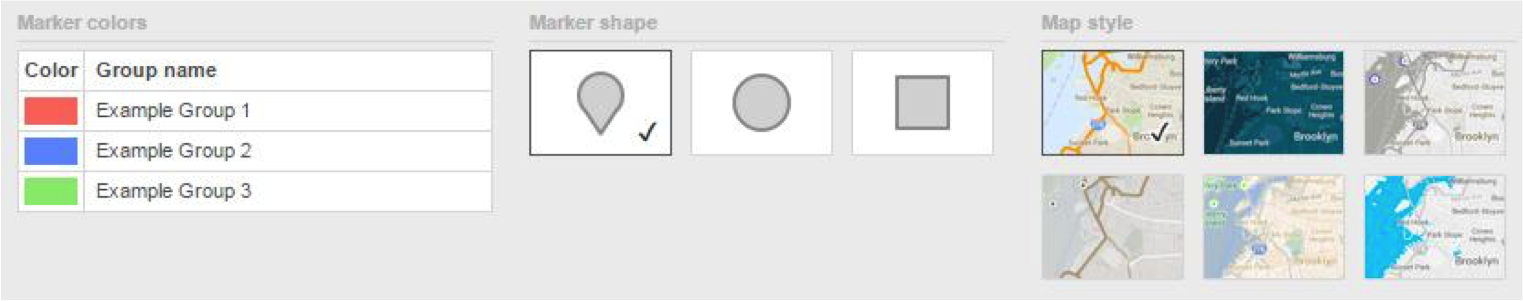
Differentiate your map from other Google Maps with BatchGeo’s six styles; select Show Advanced Options to explore.
Figure 10: Customization Options in BatchGeo
Make sure BatchGeo is correctly coding each of your header rows by clicking Validate and Set before mapping. The tool works best when the header rows are labeled and ordered in keeping with BatchGeo’s template spreadsheets. Try columns in the following order: Name, Street Address, City, State, and then any characteristic variables.
Limitations
You need a Pro account to log on to the site to view and manage all your created maps, so keep track of the autogenerated emails that BatchGeo sends with your map links, which allow you to access, link to, and edit your maps.
BatchGeo is designed for nonprogrammers. The flip side of its ease of use is more limited customization options (for example, you can’t change the HTML to alter the formatting of data windows beyond the preset styles).
These tools provide hassle-free geocoding (i.e., address-to-latitude/longitude conversion) and mapping services. Maps can be enriched with dozens of built-in layers and geographical boundaries, including school districts. Geocodio Maps are free up to 250 records per map.
This application specializes in mapping and spatial data analysis. It allows you to build maps with one or more layers (e.g., zip codes, school districts) and analyze associated data that has a spatial component. See the National Center for Education Statistics’ EDGE Geodata for an example of maps developed with ArcGIS.
Published December 2022.
If you require an accommodation to access any DaSy Resource, please contact DaSy.
To provide the best experiences, we use technologies like cookies to store and/or access device information. Consenting to these technologies will allow us to process data such as browsing behavior or unique IDs on this site. Not consenting or withdrawing consent, may adversely affect certain features and functions.
Functional
Always active
The technical storage or access is strictly necessary for the legitimate purpose of enabling the use of a specific service explicitly requested by the subscriber or user, or for the sole purpose of carrying out the transmission of a communication over an electronic communications network.
Preferences
The technical storage or access is necessary for the legitimate purpose of storing preferences that are not requested by the subscriber or user.
Statistics
The technical storage or access that is used exclusively for statistical purposes.The technical storage or access that is used exclusively for anonymous statistical purposes. Without a subpoena, voluntary compliance on the part of your Internet Service Provider, or additional records from a third party, information stored or retrieved for this purpose alone cannot usually be used to identify you.
Marketing
The technical storage or access is required to create user profiles to send advertising, or to track the user on a website or across several websites for similar marketing purposes.