
- Overview
- Toolkit Overview
- Introduction to Data Viz
- Resources
- General Considerations
- Accessibility
- Color
- Caution: Read the Terms of Use
- Types of Visualizations
- Charts
- Dashboards
- Data tables
- Infographics
- Maps
- Qualitative
- Enhancing Engagement
- Animations
- Interactivity
- Presentations
Presentations Data Considerations
Tables and especially charts are useful alternatives to long text passages on slides. A well-designed chart can get a point across in little enough time that it hardly interferes with simultaneous spoken text. Better still, a truly visual graph is not processed sequentially, so it does not compete for the same intellectual resources as text; its complexity is often in its depth, not its breadth.
Example: Presenting IDEA Data
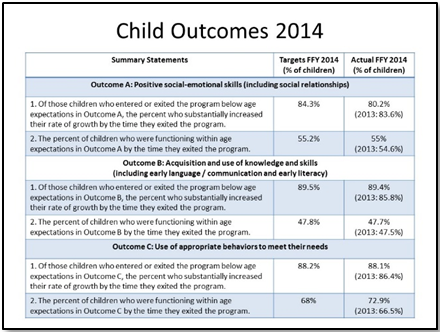
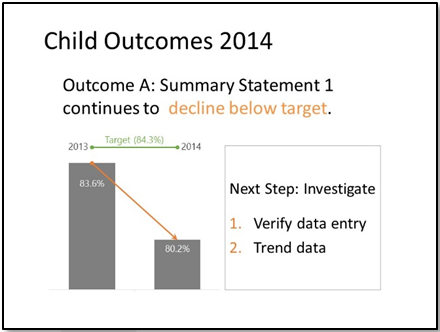
The following before (Figure 1) and after (Figure 2) example shows how an all-too-commonly-seen presentation slide — with an overabundance of content and no stand-alone contextual value — can be converted using the principles shared here and in other sections of this toolkit.
Figure 1. Original PowerPoint slide containing child outcomes data table. |
Figure 2. Revised slide using the above mentioned principles, hints, and tips for slide-crafting and data visualization. |
| 
|
See the Charts page for examples of common data visualization formats used in early childhood presentations.
Published December 2022.