The resources and tools below are provided as useful examples only. The DaSy Center is not affiliated with, sponsored by, or endorsing any of the listed resources and tools. For guidance on understanding how modern data visualizationsoftware handles data, visit the Caution: Read the Terms of Use section.
Infographics Resources
Infographics are popular because they offer data in appealing packages that can be quickly absorbed and shared. Vox offers a helpful blog and infographic explaining why infographics are useful. Check out Neomam and Hubspot as well.
There is a variety of good sources for infographic layout ideas.
Check out the infographic templates on the web-based infographic applications in the Tools section (Venngage, Piktochart, Easel.ly). These templates demonstrate best practices in infographic design and are great at getting your creative juices flowing.
Start with a simple Google image search for infographics. To narrow your search and yield more relevant results to what you are trying to create, search for a specific topic + infographic. For example, “special education infographic.”
Search for “infographic” on Pinterest for more creative ideas.
The Mashable media company shares its infographics on Visually.
Browse the Office of Special Education Program’s Fast Facts which summarize key facts related to specific aspects of the data collection authorized by Section 618 of the IDEA.
Telling Your SSIP Story in an Infographic: Strategies, Tips, and Examples
This brief offers guidance on the varied uses and audiences for infographics, best practices for creating infographics, and examples of state SSIP infographics. The brief also provides an exemplar SSIP infographic and instructions on how to access the template through a technical assistance provider.
Infographics Tools
Several free and low-cost online tools are available to develop high-quality and professional infographics. Read on to learn more about some of DaSy staff’s favorites. You can also access this blog for more information on comparing the available tools.
ArcGIS StoryMaps
ArcGIS StoryMaps is an online infographic tool focused on interactive storytelling with dynamic elements like text, images, charts, and maps. StoryMaps features seamless integration of ArcGIS maps. StoryMaps itself is free but requires an ArcGIS license, which nonprofits, local municipalities, and individuals can purchase at a low cost. EI and ECSE staff can use StoryMaps to create a modern infographic with geographical emphasis.
Easel.ly
Easel.ly is an online website that offers free infographic templates as well. Its Public Visuals library includes over 2 million shared user infographics that can provide inspiration. The paid plan costs $3 per month.
Skill level
Beginner
Accessing the tool
Sign up at the Easely.ly website using either your email, Facebook, or Google Plus account.
General How-To
Select a template from the fairly extensive variety.
Add Objects by typing in words in the search box or perusing a lengthy list of categories. Once you select a category, a strip of icons will appear near the top of your screen. You can navigate left or right for more options using arrows. Simply drag the object of your choosing onto your canvas.
To edit an Object, click on it and an additional menu will appear at the top of your screen that enables you to change position, opacity, or color. You can also hyperlink the object.
Using the Backgrounds button at the top of your screen, choose from a variety of colors and patterns. Again, you can navigate to more options using arrows and then drag your selected background onto your canvas.
If you’re feeling adventurous, you can use the Draw button to add your own straight, crooked, or curvy lines, or arrows.
The Shapes button offers a wide variety of circles, arrows, and geometric shapes. Again, you can edit by clicking on your selected shape to see the menu at the top of your screen that allows you to change position, opacity, or color. You can also hyperlink.
Add text boxes to your canvas using the Text button. Within your text boxes, the menu will allow you to select from a variety of fonts and change size, alignment, color, and styles.
The Charts button will allow you insert bar, pie, and line charts and area and scatter plots. Double-click on the selected chart to edit the data. Within the edit screen, double click on a color to change it.
Use the Upload button to select images from your computer.
Stories is an infographic feature within Flourish, a popular freemium web-based data visualization tool. According to Flourish, stories “let you create richer, more in-depth data narratives, with animation, to embed or present. Flourish stories are a bit like PowerPoint or Keynote presentations, but built for data visualization on the modern web.” EI and ECSE staff can use Stories to create a rich, modern infographic with a variety of data visualizations.
Infogram
Infogram is a freemium web-based data visualization and infographic tool. EI and ECSE staff can create charts, infographics, dashboards, and maps and embed them in their websites. Infogram also has an extensive library of royalty-free media. Infogram features artificial intelligence to enhance the workflow.
Click on the type of project you want to create. For this purpose, click infographic.
Select from the few free templates or select a blank template.
Choose if you want the project to be public on the Web or private. (Note: To keep the project private or public with privacy controls, you must upgrade from the free version.)
On the left-hand side of the screen, click on the various icons to add text, maps, graphs, shapes, multimedia, and/or data sources.
You can change the font, height, letter spacing, etc., of the text by clicking on your text and manipulating the categories in the box to the right side of the page.
When your infographic is completed, you can download the final visual as a JPG, PNG, or PDF (PDF available only in upgraded version) by clicking download. You can also choose to share your project on the web by clicking share; a shareable web link will appear.
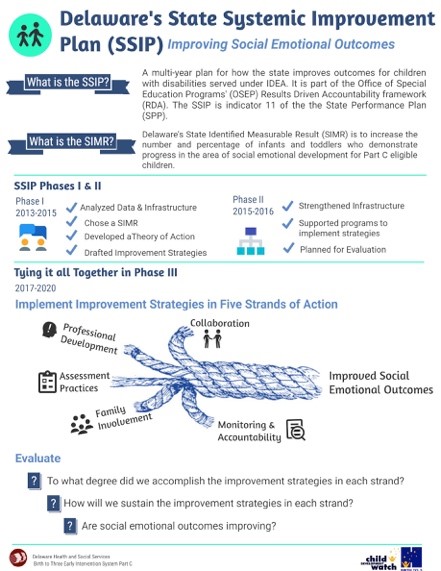
Example:
Tips for Creating Effective Displays
When creating your infographic, click on the How can we help you window at the bottom right-hand side of your screen. Here you can access tutorials with videos, learn how do import data, make charts and maps, and change colors. You can also chat with support.
Piktochart
Piktochart is another commercial vendor that offers a variety of design tools and offers a few free templates to help users get started with specific tools. They’re known for offering an intuitive user interface. You can “level up” for access to more templates for $15 or $29 per month.
Select from about a dozen free templates (note that the subscription-only templates are shown on the same page; you won’t be able to use those without paying). You can Preview the template or Create a new infographic in the template.
In the Graphics menu at the top left of your screen, select from a variety of shapes, icons, photos, and frames.
Upload your desired images from your computer using the Uploads menu.
Adjust the Background colors, patterns, and opacity using the menu.
Explore different Text options including heading types and text frames. Note that you won’t be able to select your own font; each template has specified fonts assigned.
Use the Tools menu to insert charts, maps, or videos.
The Import menu allows you to link to your Survey Monkey account (to pull in data – new feature, not fully tested yet).
Moving to the top right menus, you can Save, Preview, Download, Publish, or Share your infographic with your social media accounts.
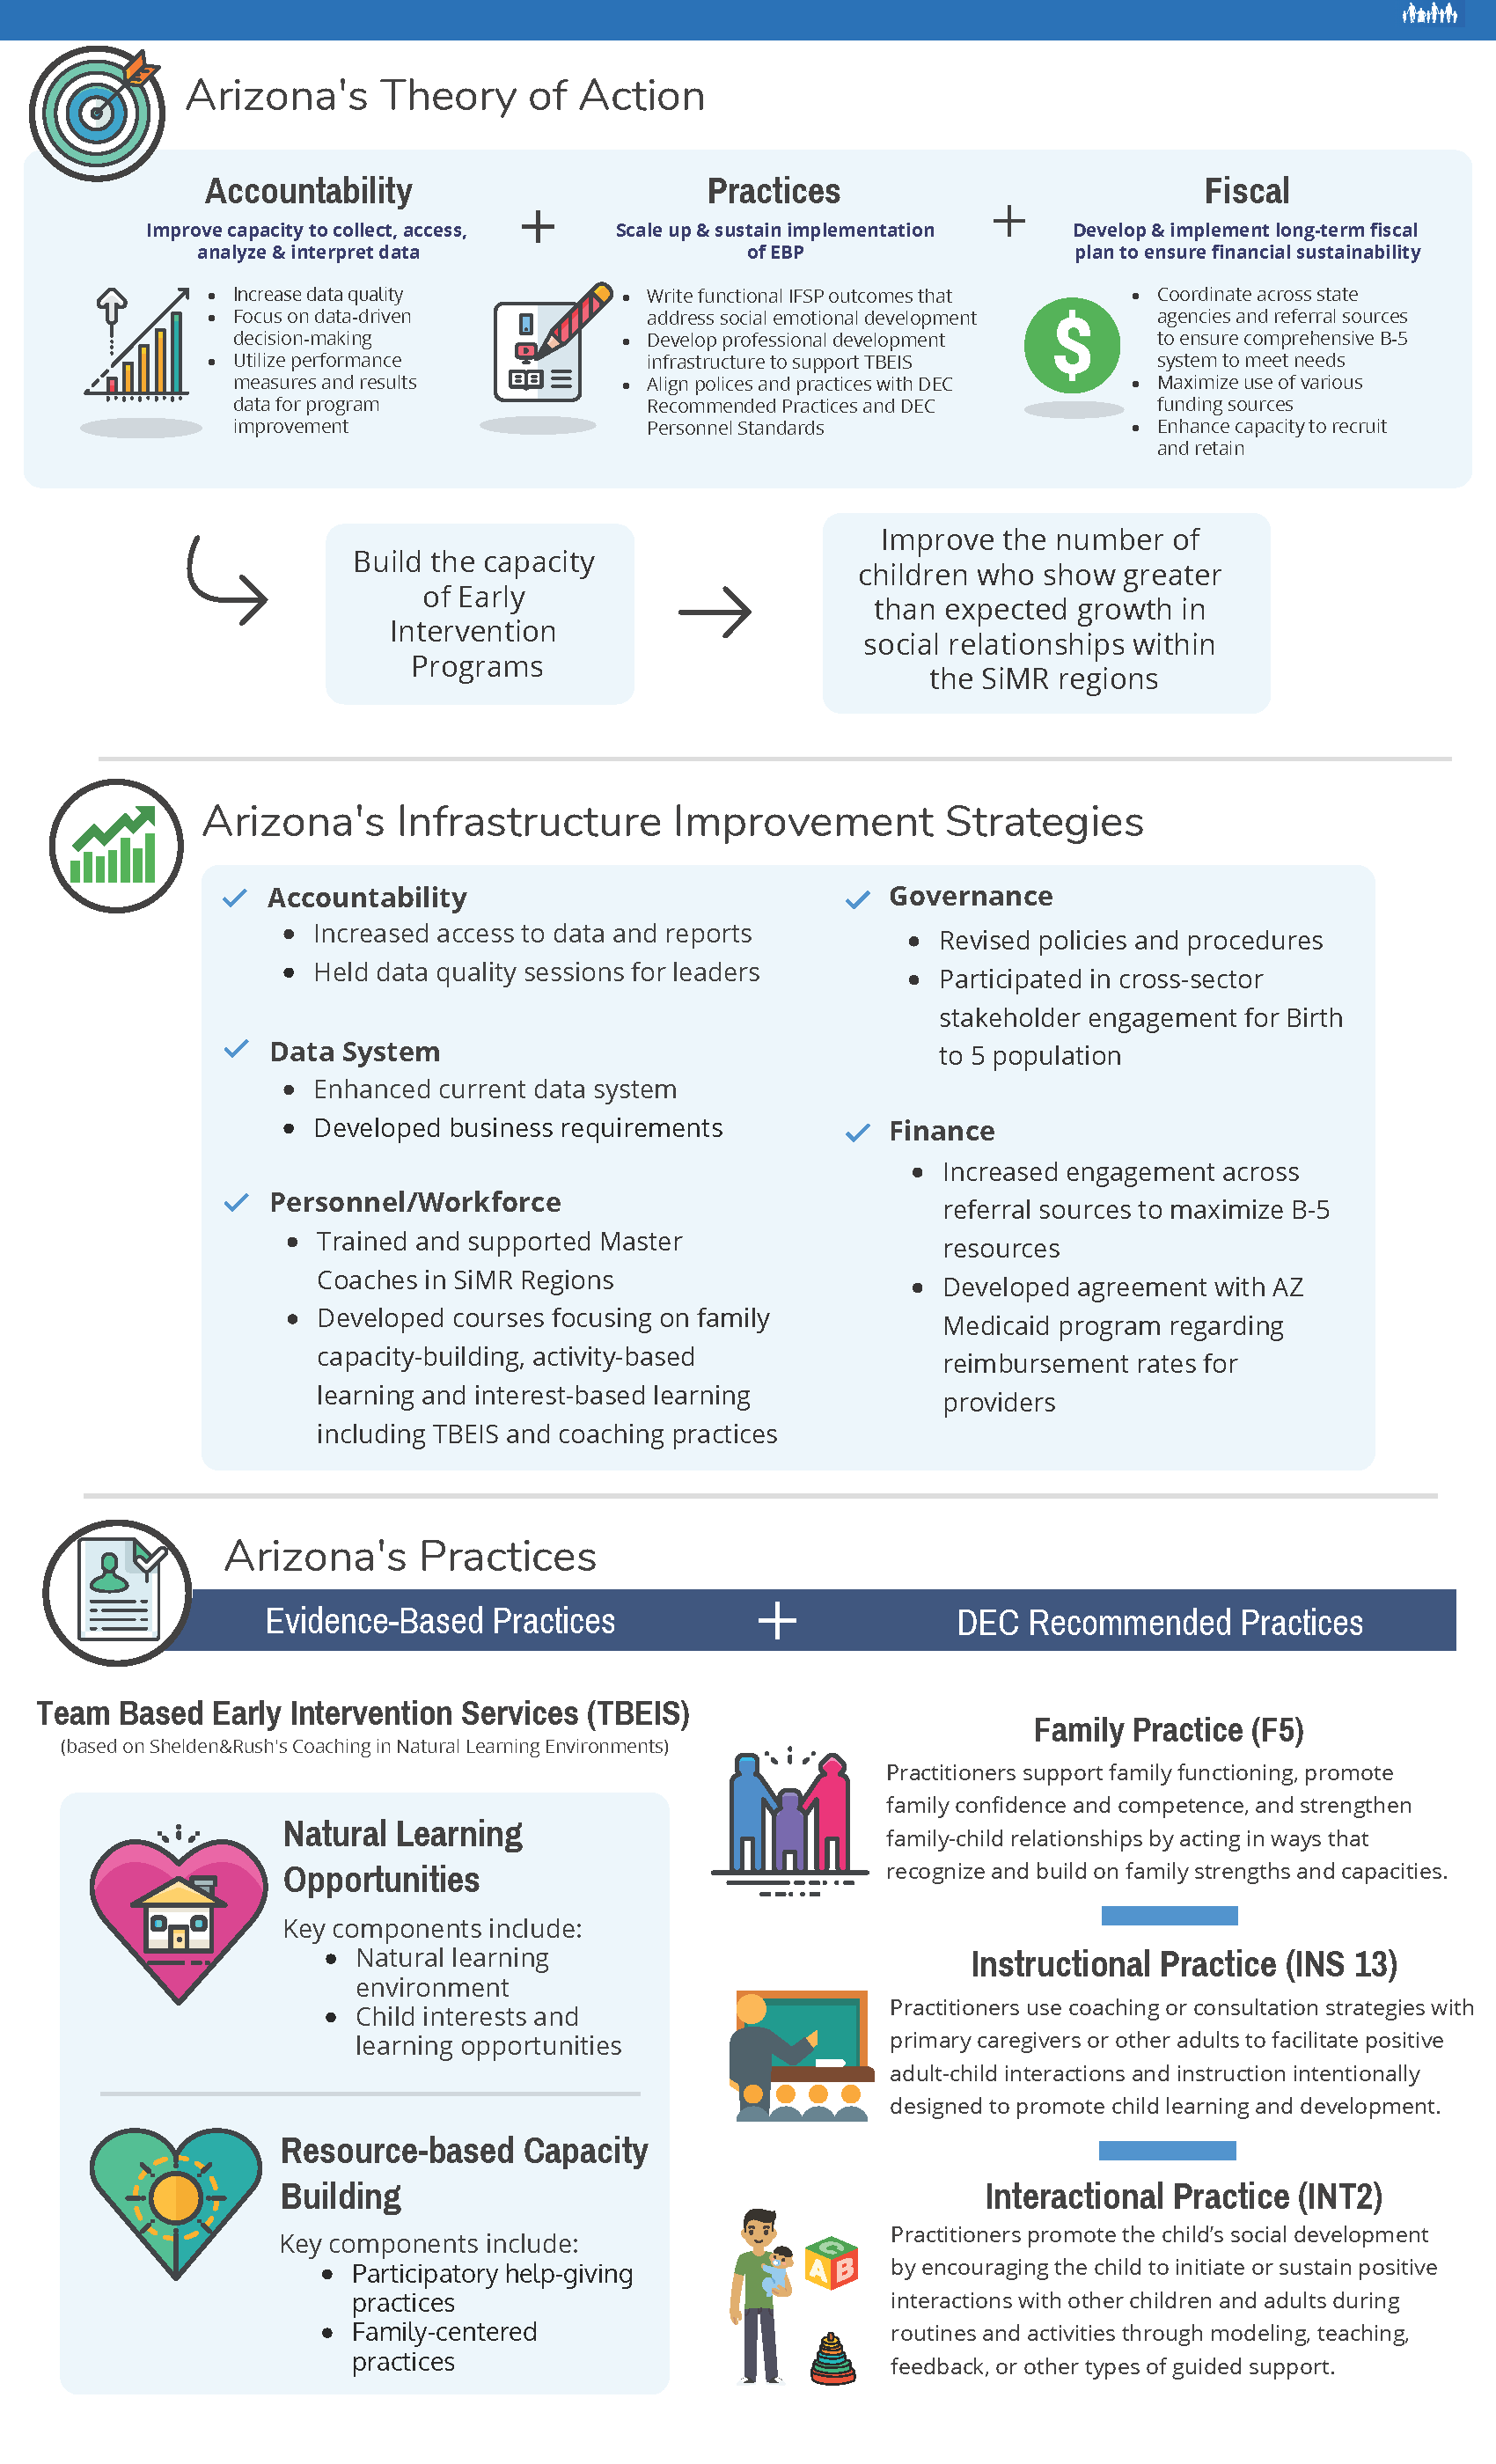
Example:
.
Tips for Creating Effective Displays
Piktochart offers a list of 8 design tips, each of which is explained and illustrated in a blog post. Some unique tips include:
How to create a hierarchy with fonts and visual elements to tell one story
How to get away from too much text and go visual
Choosing the color palette: Tools for pairing colors
Bonus example:
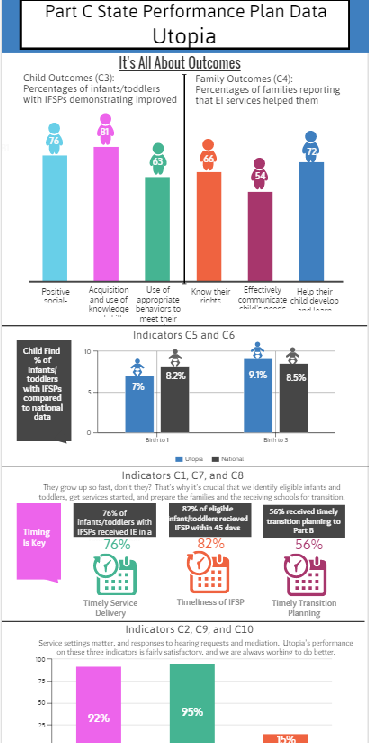
Venngage infographic depicting fictional state data for Part C SPP Indicators:
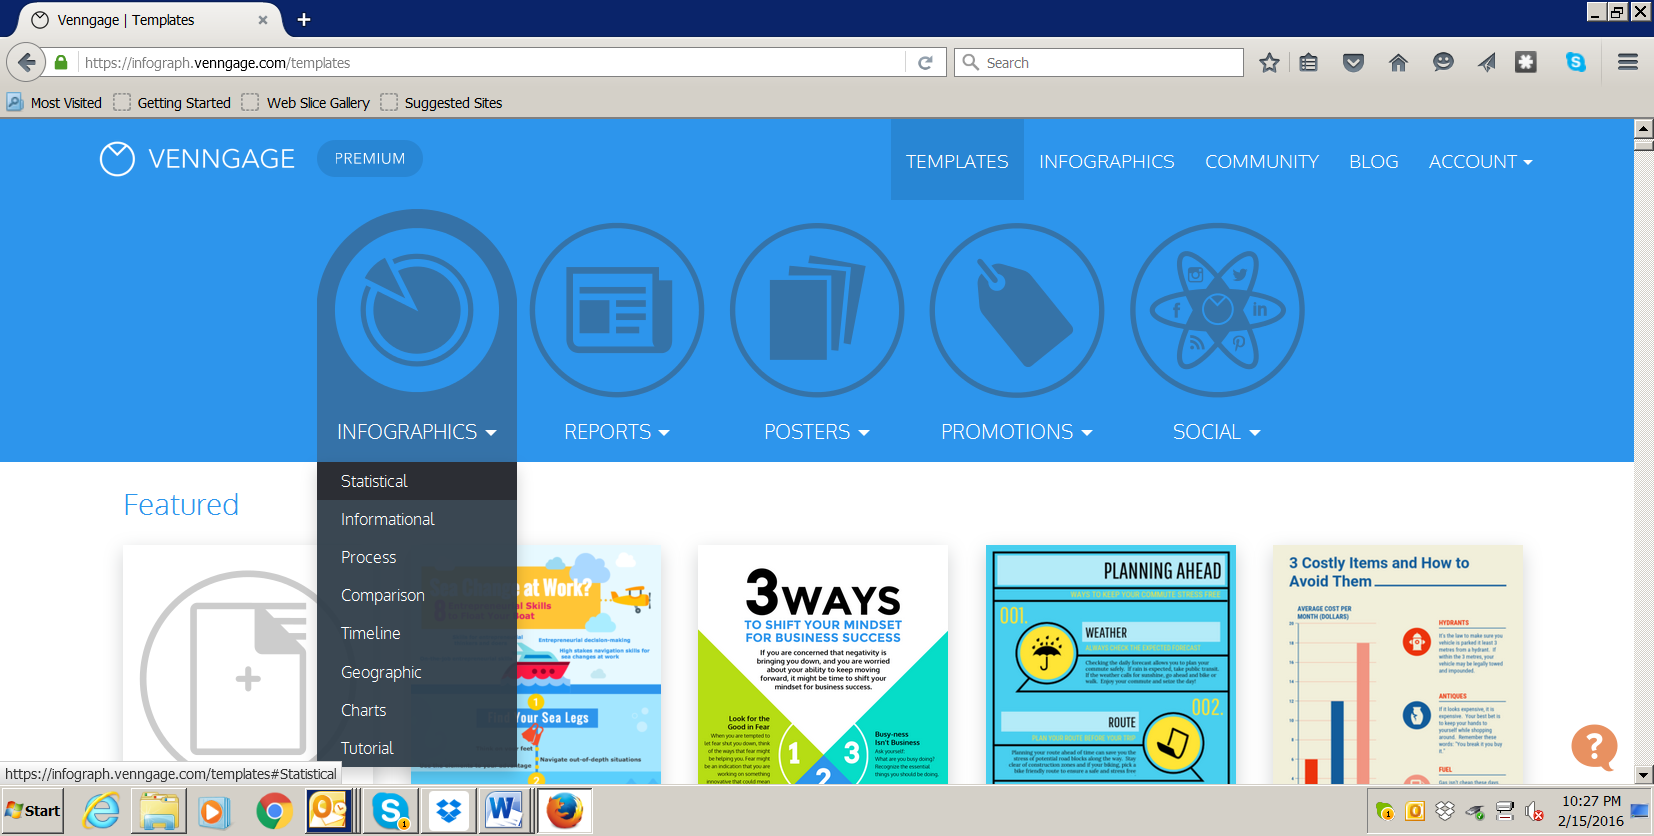
Venngage
Venngage offers a variety of design tools. Like many design companies, it offers a few free templates to help users get started with specific tools. Upgrading to Premium ($15 to $19 per month) gives access to more templates and the ability to create more infographics.
Browse infographic templates from the drop down menu. Select a template from the available free templates that fits the message that you want to convey. The template in the example below is Sweet Blue. It was selected from the statistical infographic templates because the state team wanted to enter its own data in the chart area (lower right section).
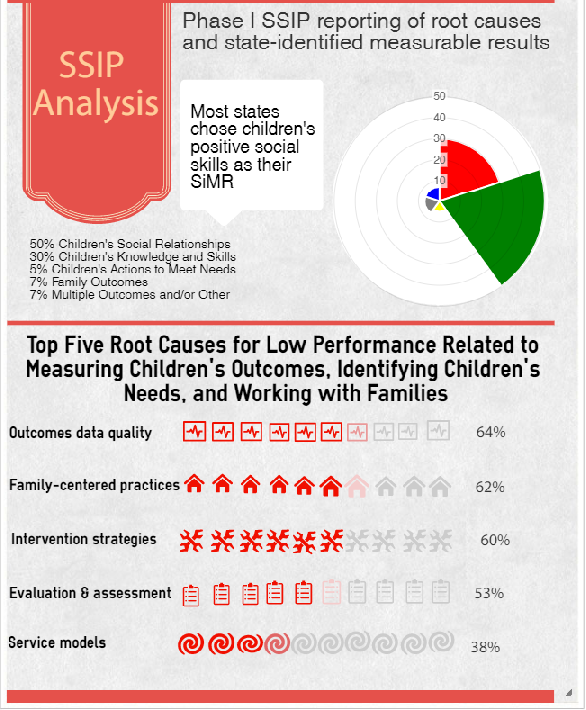
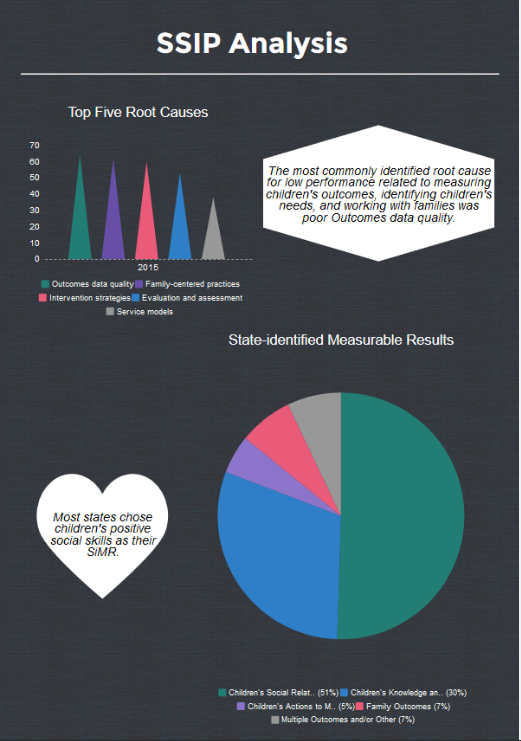
In this example, information from the Early Childhood Technical Assistance Center (ECTA) website was used by a state agency and its stakeholders to create an infographic that conveyed key information about the goals in the State’s Systemic Improvement Plan (SSIP).
Click on the template and start creating your own infographic.
Add widgets to your Infographic. Drag and drop charts, icons, maps or text onto your infographics. You can show or hide each category by clicking on the arrows.
Undo, copy or move your text. Click on any widget and use buttons to edit, copy, move to front/back or delete.
Edit the widget settings. Click on any text, image or icon to edit it. The settings will appear on the tool bar on top. Double click to edit charts. The chart settings will appear on the right.
Publish! Once you are done with your infographic, you can publish it on your website, share via social media or download it as an image.

 .
.