- Overview
- Toolkit Overview
- Introduction to Data Viz
- Resources
- General Considerations
- Accessibility
- Color
- Types of Visualizations
- Charts
- Dashboards
- Data tables
- Infographics
- Maps
- Qualitative
- Enhancing Engagement
- Animations
- Interactivity
- Presentations
Infographics Data Considerations
Geographic Differences
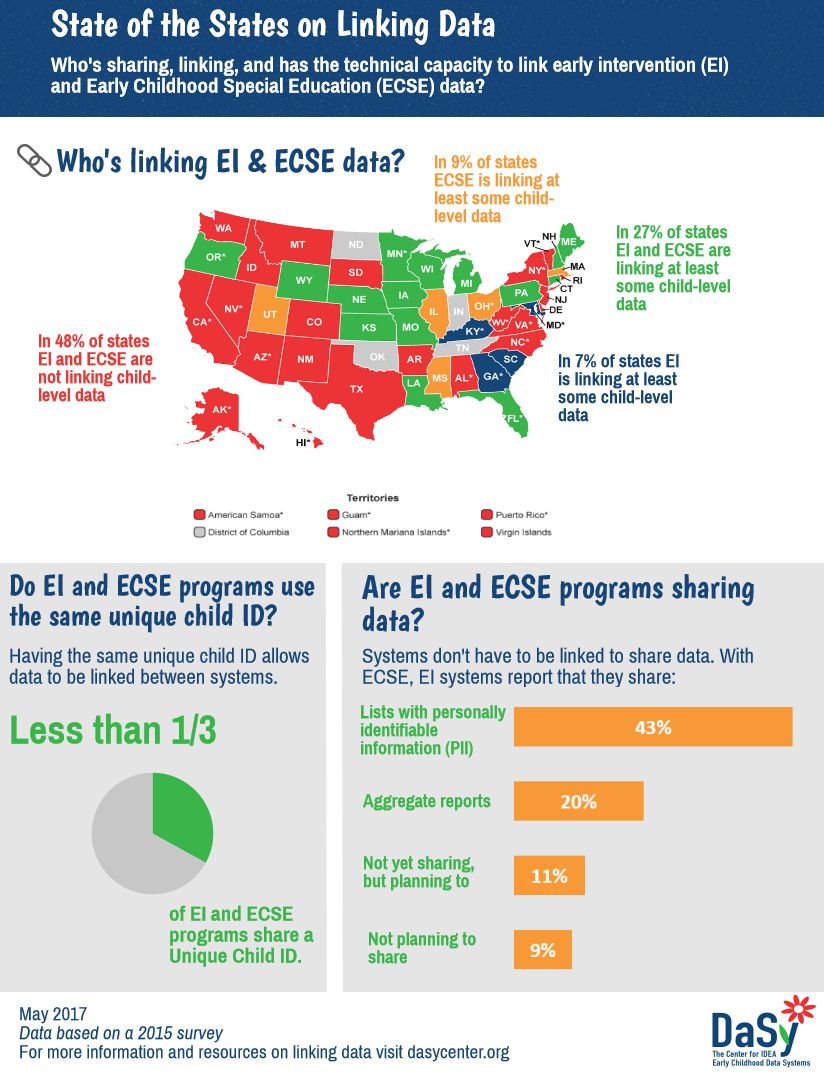
Infographics that include maps can be used to compare data across locations. This infographic from DaSy’s 2017 Focus on Linking Part C and Part B 619 Data week offers data from our 2015 state survey on linking data. The combined use of a map and different colors illustrates geographic differences in which states are linking early intervention (EI) and early childhood special education (ECSE) data, what proportion of states use the same unique child ID for both EI and ECSE programs, and how EI and ECSE programs are sharing data. See the linking data infographic.
Read More +Timelines
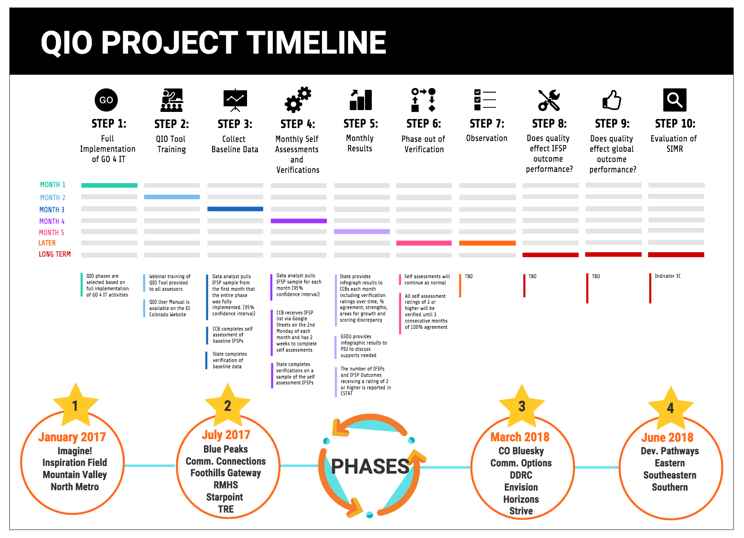
Consider a timeline infographic to show change over time or a flow of activities. Colorado’s infographic outlines its project timeline for SSIP implementation, particularly related to use of the Quality IFSP and Outcomes (QIO) Assessment Tool to rate the quality of IFSPs. The tool is used at the local level for self-assessment by supervisors and managers. The state completes verifications on a sample of the self-assessment IFSPs. All 10 steps on this timeline represent progress toward achieving the state’s short-, intermediate-, and long-term outcomes. The full infographic is available at Venngage.
Read More +Lists
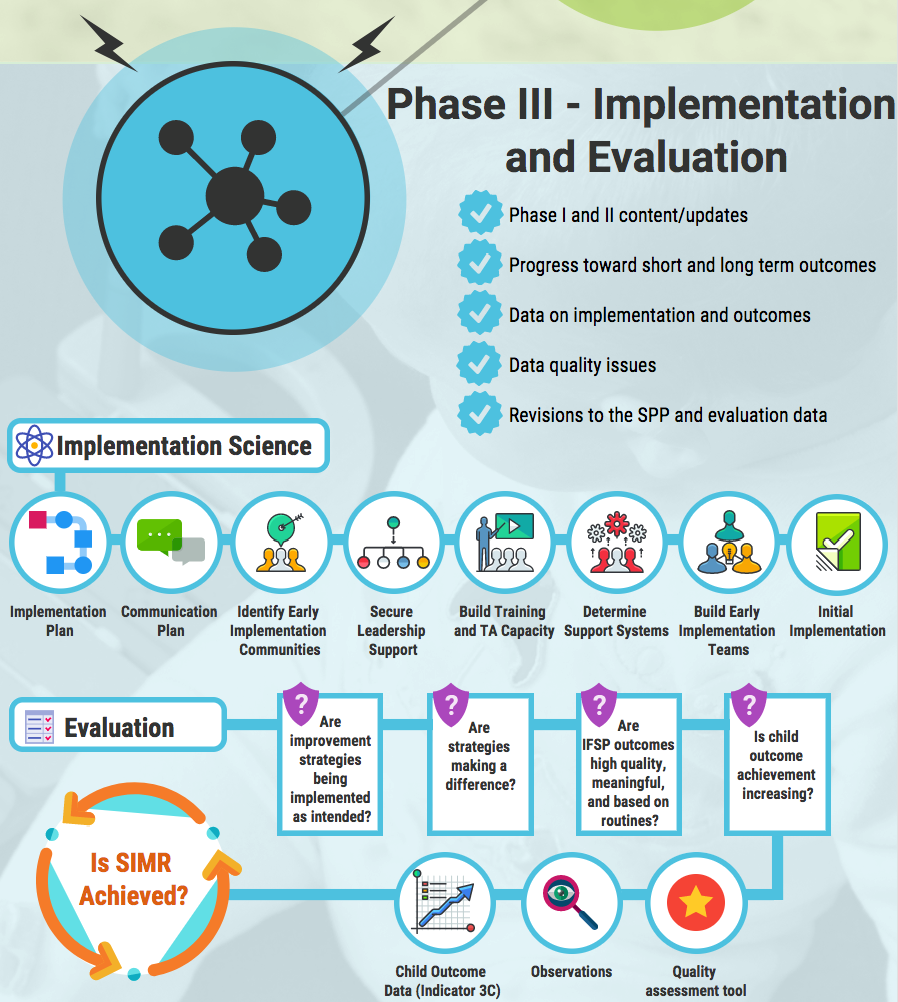
Infographics can display different types of services or activities in lists (Figure 5).
Read More +Process or Steps
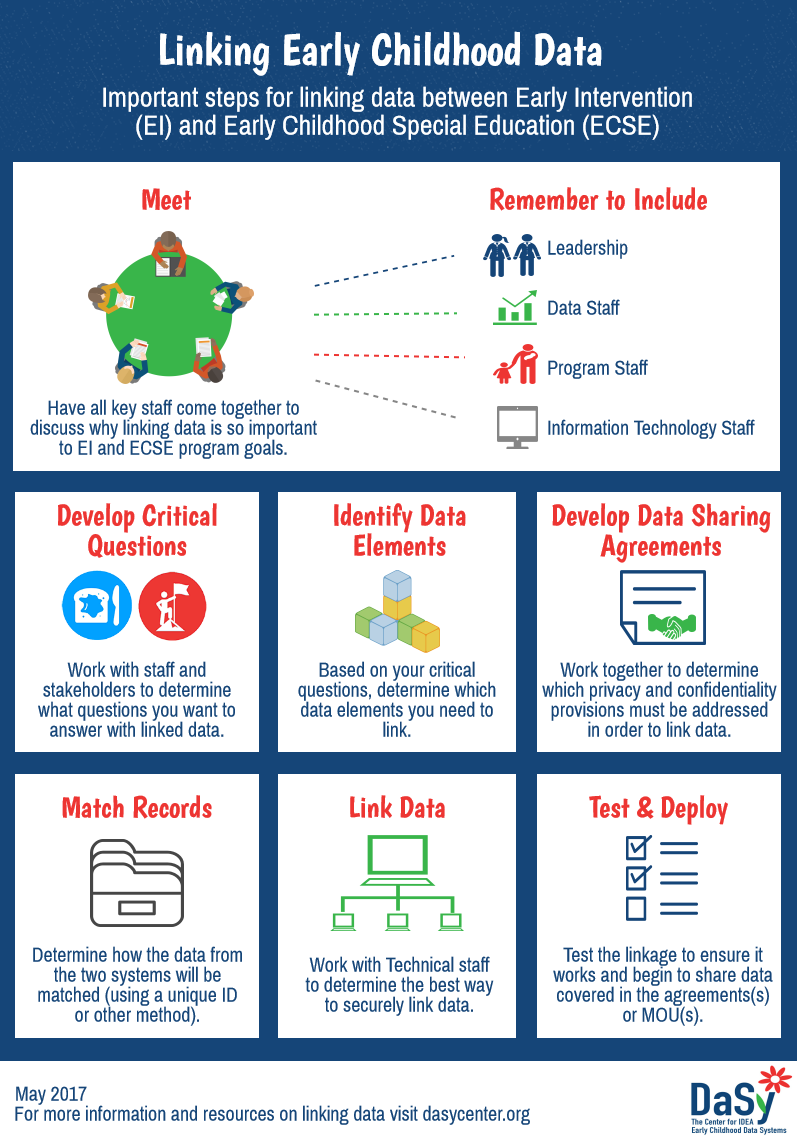
Infographics can show the flow of information or steps in a process. This infographic from DaSy’s 2017 Focus on Linking Part C and Part B 619 Data work lists some important steps for states to consider when linking data between EI and ECSE. It can be a useful tool to share when approaching conversations with data partners about linking. See the linking early childhood data infographic.
Read More +Metaphors
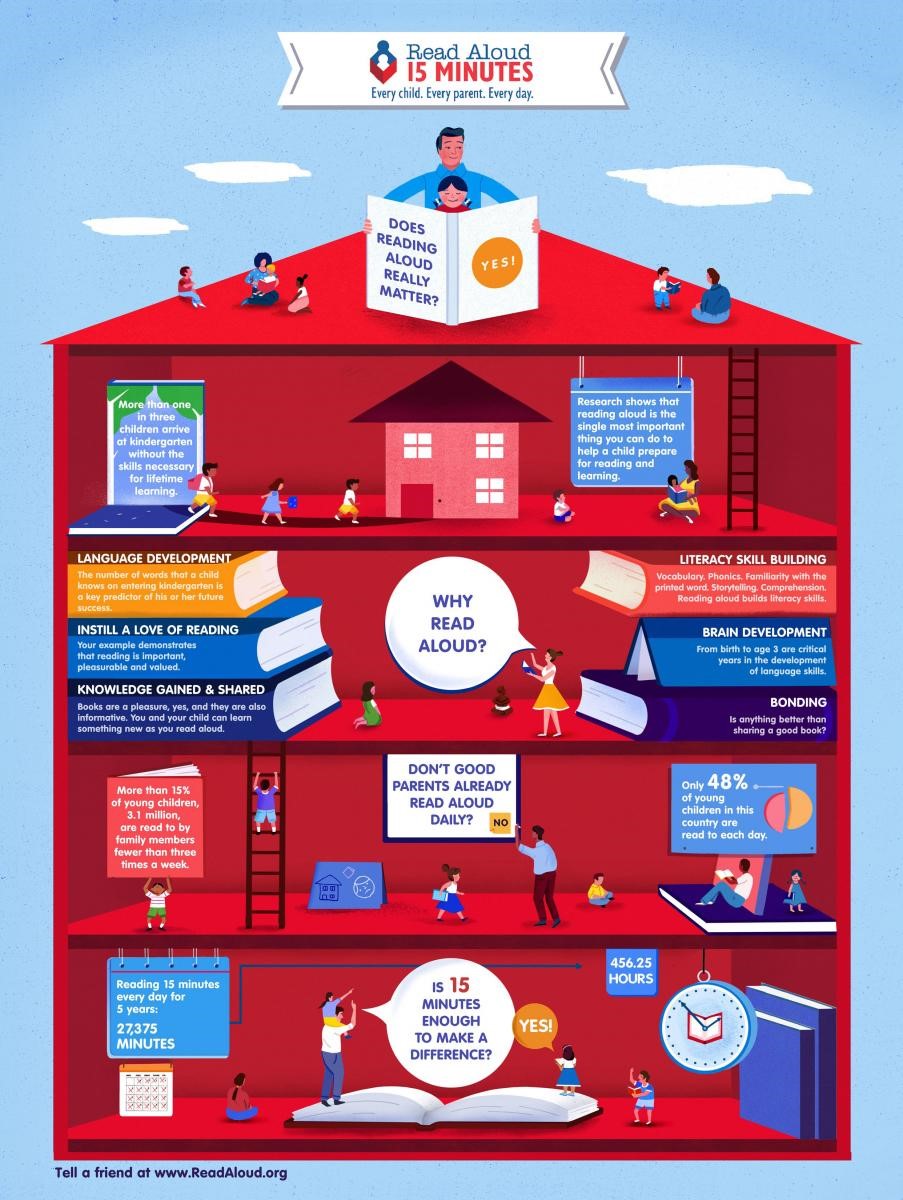
Metaphors can help viewers understand complex data. This infographic by United Way of York County illustrates the importance of reading aloud to young children to build literacy skills, encourage language development, and strengthen social emotional relationships. Each story of the house represents another layer of information that builds on the other.
Read More +Published December 2022.


