
- Overview
- Toolkit Overview
- Introduction to Data Viz
- Resources
- General Considerations
- Accessibility
- Color
- Caution: Read the Terms of Use
- Types of Visualizations
- Charts
- Dashboards
- Data tables
- Infographics
- Maps
- Qualitative
- Enhancing Engagement
- Animations
- Interactivity
- Presentations
Data Tables Data Considerations
Consider the degree of detail your audience needs for effective data-based decision-making. If trends or a comparison of general magnitudes is sufficient, consider summarizing them in a chart. However, if detailed data points are needed or your audience is there to help you better analyze the data, a data table is the better choice. When presenting data points, there is no rule of thumb as to how many digits to include. However, consider rounding the numbers as much as you can without losing their meaning or what differentiates them.
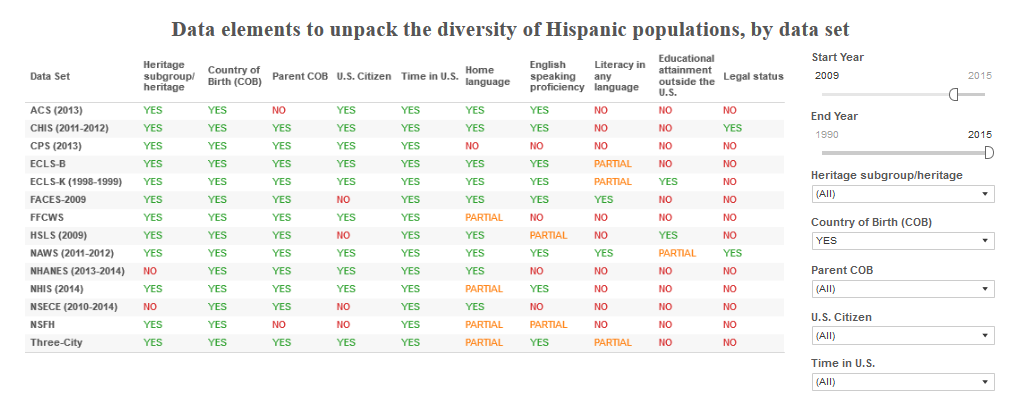
If you have a large amount of data to summarize in a data table, consider using an interactive data table (see screenshot in Figure 4) that allows the user to filter by the date or category of interest. Access the interactive data table to use filter.
Table 4: Interactive Data Tables Allow Users to Filter
Published December 2022.