

Authors: Howard Morrison & Mary Lee Porterfield
Contributors: Meghan Young, Erika Alvarez
State Part C (early intervention) programs must report annually to the Office of Special Education Programs (OSEP) about how well the programs supported families to understand their rights, advocate for their children’s needs, and support their children’s learning and development (see ECTA’s family outcomes page for more info). Most states collect data on these outcomes by surveying families.
To help states improve their family survey process and outcomes, DaSy/ECTA launched an intensive technical assistance cohort on the topic. For two years (2020 to 2022), DaSy/ECTA technical assistance staff worked with state Part C teams to dig into their family outcomes survey data and decide how to increase the response rate and improve family outcomes.
Texas was one of the cohort states. The Part C team knew that survey results at the state level were different (better) than survey results by program. Some local programs were better than others at getting surveys back from families. At the time, local programs weren’t getting enough data back from the state to know which demographic groups were not completing the surveys, and they didn’t have a lot of time for deep data analysis. The Texas Part C team decided to create data dashboards for each local program so program staff could see how they were doing and decide how to make improvements.
Engaging Key Staff
DaSy staff began by working with the Texas cohort team, which included the state Part C Coordinator, Family Liaison, Data Manager, and Outreach and Training team members, to define what they wanted to do (through a use case) as well as determine steps and a timeline to accomplish the work.

The Texas Part C team finalized critical questions about program, family, and child outcomes. To learn more about how to do this, visit DaSy’s Critical Questions About Early Intervention and Early Childhood Special Education
To develop the use case, the Texas team discussed the purpose and goals for the data dashboard as well as who would be using it (the audience). This discussion included identifying the critical questions about program, family, and child outcomes that local program staff would want to answer with the data. As a team, they completed a draft use case over several months.
An important part of the process was to bring key users into the discussions. The Texas team met with local program staff to share the purpose and goal of the data dashboard, as well as how they expected users to interact with it. The team then asked local program staff for feedback and input on the draft use case and data dashboard.
The new Texas Part C data dashboard includes:
- Visualizations for survey response rates and scoring
- Data and visualizations on survey responder and non-responder characteristics
- Primary language, gender, race and ethnicity, county or ZIP code
- Child age at referral and during the survey period
- Service hours
- Medicaid status
- Child outcomes
Example Visual from the Data Dashboard
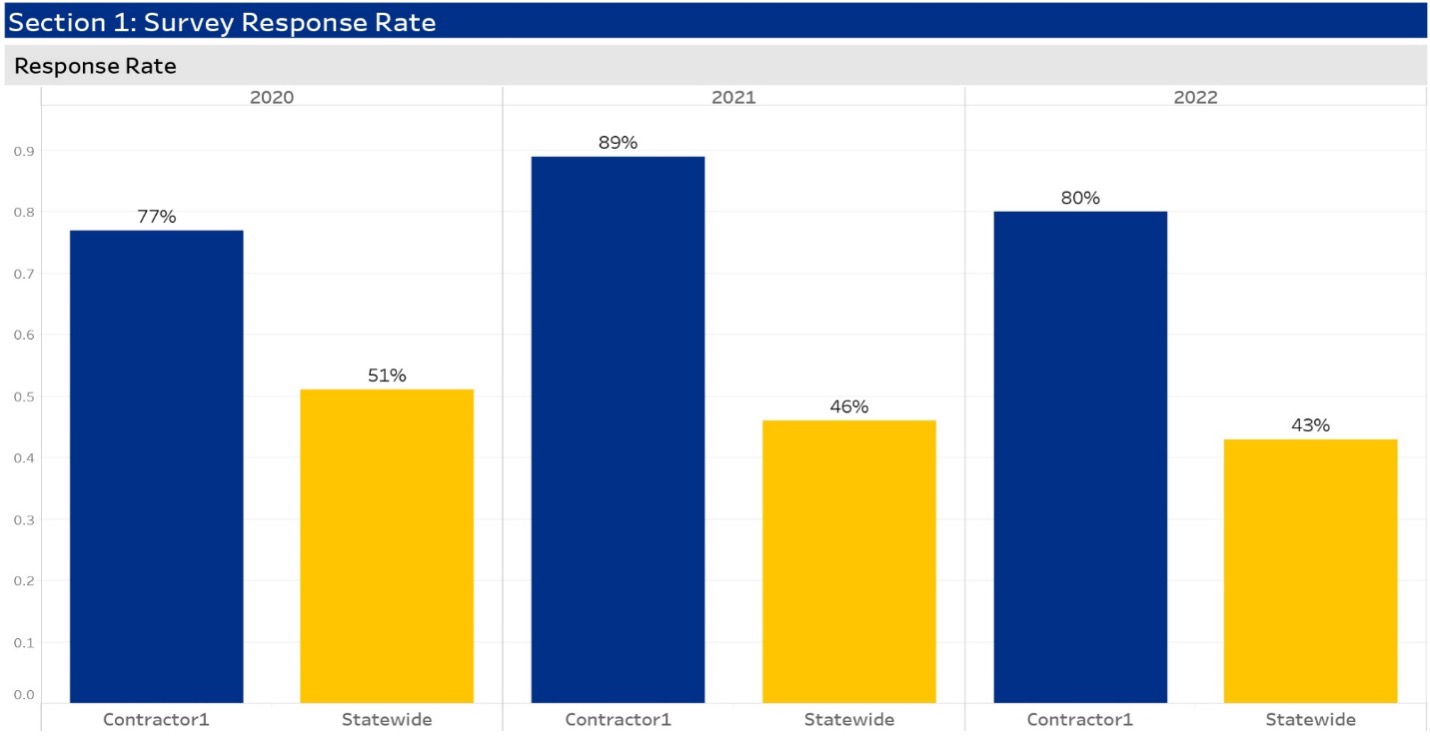
Note:Texas refers to a local program as a “contractor”.
Engaging Key Constituents in a Pilot
The Texas team identified five local program sites across the state to engage in a data dashboard pilot. These sites represented different entity types (e.g., large, small, urban, rural) and had both high and low response rates on family surveys. The Texas team started with a webinar to walk the pilot sites through the dashboard and then held multiple sessions to get feedback on the visuals in the dashboard. They also provided a draft data dashboard, user guide, and a survey to each site to collect feedback at the end of the pilot.
Once the pilot was complete, the Texas team compiled the feedback, discussed the feedback with DaSy staff, and made relevant updates to the data dashboard and guidance documents.
Pilot participants shared some feedback on using the dashboard for other local programs:
- “Get some people that you work with … and go in there with an open mind and know that there are some areas you may need to do some work in and dig down into it and see what questions you can come up [with] and look at the data and see how that can help you improve your program. We can’t fix it all at once, but I think the dashboard gave us things to work on and to shoot for.”
- “This really shows us what areas we need to focus on and work on to better improve the services for our families.”
- “It will really in the long run help your program identify where the strong points are and maybe some of the weaker points and allow you to strive to be stronger.”
Statewide Launch and Continuous Improvement
Following the pilot, the Texas team prepared for the statewide launch of the data dashboard. They developed a slide deck and recorded a video for the launch and included a letter from the state Part C Coordinator with an overview of the dashboard and who to contact for support. As part of the launch, the Texas team engaged pilot participants to share their experiences in recorded messages. These messages were incorporated into the launch video.
To support continuous improvement, the Texas team is providing individualized support to local programs. Additionally, they are presenting the data dashboard at upcoming meetings and trainings so local program staff can learn about the dashboard.
Looking to Develop New Reports or Data Dashboards?
- Review and discuss the approach Texas took with your team
- Identify a core team to support the effort
- Contact your DaSy Technical Assistance Liaison for support
Resources for Ongoing Learning
- Family Outcomes
- Critical Questions About Early Intervention and Early Childhood Special Education
- Automated Data Sharing or Linking Use Case: IDEA Part C to Part B 619 Transition Notification
- Look! Think! Act! Using Data for Program Improvement
About the Authors

Howard Morrison is a DaSy Early Childhood Technical Assistance Specialist at SRI. He works in all aspects of early childhood care, education programs, and services, but he primarily focuses on statewide early childhood data systems, specifically data governance, linking, and integration of early intervention and early childhood special education data. In his role, he applies his systems-thinking and relationship-building skills, and an equity lens to his projects.

Mary Lee Porterfield, PhD, is a Senior Education Researcher and Technical Assistance Specialist at SRI with expertise in early childhood development and education, early intervention, and family engagement, and more than 15 years of experience in the early childhood field. Dr. Porterfield co-leads the Child Find ACCESS project and serves on DaSy workgroups focused on child and family outcomes, child find, accountability, and data governance.
Published May 2025.