
Authors: Robin Nelson, Cornelia Taylor and Jenna Nguyen, DaSy
“Data is like water; neglect its quality and fear the indigestion.” – Adrien Saint
Don’t let poor data quality give you indigestion.
Why should our state care about child outcomes data quality?
Having high-quality child outcomes data is more important than ever. The data are a focus of accountability in OSEP’s Results Driven Accountability Initiative. State early intervention and preschool special education programs collect and use these data to measure progress towards program-level and system-wide outcomes. As such, child outcomes data are visible to a broader range of stakeholders, including state legislators and our partners in other early childhood programs. When the data are not trusted, they erode stakeholder perceptions about the usefulness of the data for decision making and can hinder progress. Child outcomes data must be valid so that education partners can make well-informed decisions about system and practice improvements.
Checking child outcomes data quality – how do I get started?
Here at the DaSy Center we know that states don’t have a lot of time to conduct ongoing reviews of their child outcomes data collection procedures. To support states in taking the pulse of their child outcomes data, we annually provide each state with its own child outcomes data report, called the State Child Outcomes Data Profile. This profile will help you review different aspects of data quality for your child outcomes.
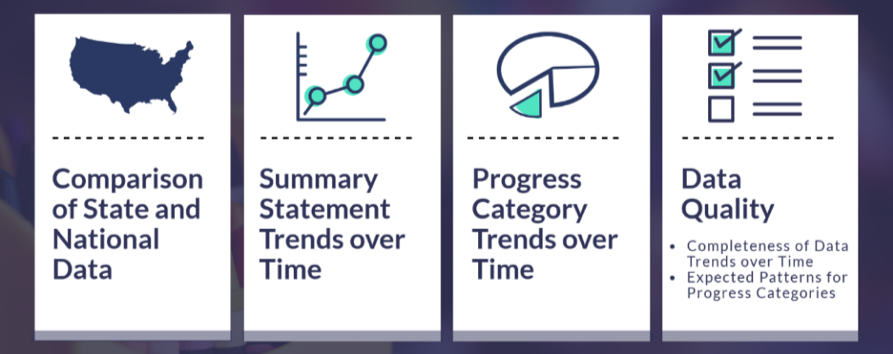
The State Child Outcomes Data Profile contains several components, as displayed below:
Lisa Backer, MN ECSE Supervisor
Alice Ridgway, CT Part C Coordinator
Using the Profiles
The charts and tables in the Child Outcomes Data Profiles can be used to:
- Identify trends in state performance and data quality issues that require further exploration
- Share information with various audiences (charts can be pasted into state documents and presentation materials)
We know that high-quality data show predictable patterns, and data in the Child Outcomes Data Profile will help you identify expected and/or unexpected patterns in your state data. Depending on the data available in your state, you may also have the capacity to do more pattern checking beyond state-level aggregate data, e.g., by entry scores, eligibility subgroups, family characteristics, language, geography, age at entry, or other child characteristics. The DaSy and ECTA pattern checking resources can be used to identify methods for reviewing patterns to determine if they are reasonable. In addition, DaSy and ECTA have developed a suite of Excel tools that can be used to analyze and display child outcomes data.
The Child Outcomes Data Profiles are typically emailed to Part C or Part B 619 coordinators in the summer. If you do not receive your profile, please reach out to your ECTA or DaSy state contact. If you have questions about your profile or need assistance interpreting any of the data, please contact Cornelia Taylor from the ECTA and DaSy Centers at cornelia.taylor@sri.com.
Identifying Activities to Improve Data Quality
When states identify that they do have data quality issues, it is critical to implement activities that will improve the quality of the data. The DaSy ECTA Child Outcomes Measurement Framework self-assessment is a tool that can be used by a state team to review current processes and procedures and identify areas for improvement. Sometimes, pattern checking will reveal that the data quality issue is not statewide but is instead specific to some areas of the state. To evaluate the quality of child outcomes data collection and identify improvement activities at the local level, states can use the Local Contributing factors tool, which identifies a set of reasons why data quality or child outcomes performance might be lagging in a certain area. Local areas can also use the Local Child Outcomes Measurement framework to look at processes related to high-quality child outcomes data and identify strategies to remedy the data.