
For a Part C system, the fiscal data profile depicts demographic, service delivery, infrastructure, and administrative data in a variety of ways to make the fiscal data more comprehensible to users.
Fiscal Data Trend Profile Template (2023)

For a Part C system, the fiscal data profile depicts demographic, service delivery, infrastructure, and administrative data in a variety of ways to make the fiscal data more comprehensible to users.
When presented effectively, data are engaging, comprehensible, relevant, and

DaSy Toolkits » Data Visualization Overview Toolkit Overview Introduction to Data Viz Resources General Considerations Accessibility Color Types of Visualizations Charts Dashboards

November – December 2022. Are you looking for better ways to share your publicly-reported data with stakeholders? Do you wish you had access to an easy-to-use tool to help you create engaging data displays?
Data visualization continues to be a hot topic in all sectors, including education, health care, government, and business. It is essential in helping to interpret data and to communicate information. When we can easily turn data into useful information, it becomes actionable. We hope you use this toolkit to advance this goal in your own work.
This DaSy toolkit provides guidance for effectively creating and presenting data visuals.

The DaSy toolkit is a resource containing information, guidance, and templates to help Part C and Part B 619 program staff build effective data teams and support conditions for a culture of data use at the state and local levels. The toolkit is organized around key steps to building a culture of data use in your state or local team.
Putting Pizzazz in Online Meetings: Using Zoom for Data Presentations and Discussions Webinar
This is the first in a series of DaSy webinars focused on collecting, analyzing, and using data through virtual engagement.
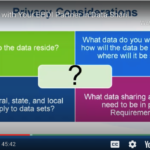
August 28, 2019 This interactive webinar highlights stories from Part C Coordinators who have or are developing collaborative data sharing agreements that allow them to share Part C data with […]
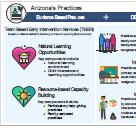
Conference: OSEP Leadership Conference Date: July 2019 Presenters: Jenna Nguyen and Alicia Sharma Infographics can be a quick and easy way to engage multiple audiences and communicate key messages in […]