Tag Archives: Data Visualization

Evaluating Implementation of Evidence-Based Practices: Tips for Improving Quality and Feasibility

Logos: ECTA and DaSy

February 13, 2019 Learn about best practices for evaluating practice change and fidelity, including characteristics of a high-quality data collection too. Hear from one state on how they have made improvements to create a feasible evaluation plan. Presented by Debbie Shaver, Margaret Gillis, Katy McCullough and Stacy Kong in February 2019 Webinar Recording Webinar Presentation

Collecting, Analyzing, and Sharing Qualitative Data Encore Webinar

Qualitative Data

This webinar includes best practices in collecting, analyzing and sharing qualitative data with an example from Louisiana’s SSIP work. This webinar also shares resources to support qualitative methods and an activity for participants to practice analyzing qualitative data. Presented by Megan Cox, Kerry Friedman, Brenda Sharp and Debbie Shaver in January 2019 Webinar Recording Webinar […]

Excel calculator for computing the Number and Percentage of Infants and Toddlers who did not Receive Early Intervention Services for at Least Six Months

This Excel tool can be used to compute the difference between valid entry and exit dates for children receiving early intervention services and count the number of children with less than or more than 6 months of service. The tool will generate a count of the number of infants and toddlers who were in the […]

Guidance for computing the Number and Percentage of Infants and Toddlers who did not Receive Early Intervention Services for at Least Six Months

This Word document provides guidance for states that can support the calculation of the Number and Percentage of Infants and Toddlers who Received Early Intervention Services for at Least Six Months. The guidance provides information about data requirements, assumptions, and data quality checks. The tool takes into account the expected variability in how states define […]

Part C Child Find Funnel Chart Tool

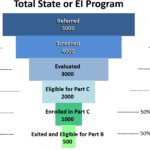
Sample funnel diagram

The Child Find Funnel Chart tool is an Excel template for displaying data about infants and toddlers at each step of the Part C process, from referral through exit, for a set of infants and toddlers referred within a specified time span. On the Enter Data worksheet, you enter data for the entire state, an […]

National Child Outcomes Results

Logos: ECTA and DaSy

October 9, 2018 In this webinar, ECTA and DaSy staff discussed results from the latest national child outcomes analysis. They reviewed national estimates, state variations in performance, and provided a quick refresher on how to interpret the state data quality reports. New TA resources related to child outcomes data collection, reporting, and use were also […]

Building a Culture of Data Use

Icon: Data Culture Resources

This webinar explored DaSy’s new Data Culture Toolkit, following the five key steps to building a culture of data use in a state or local program: Formalize your data team and its vision/purpose; assess your data use culture; prioritize your data team’s critical questions; assess and improve your data quality; and explore and use data. […]

Identify Meaningful Differences in Child Find

This Excel-based calculator allows states to make several comparisons related to the percentage of infants and toddlers served: State percentage compared to state target, local program percentage compared to state target, and year-to-year comparisons of the state percentages. It also computes confidence intervals to determines whether the difference between the two numbers is large enough […]

Fiscal Data Profile Template (2018)

Fiscal profile guidance

This Fiscal Data Profile Template (2018) displays fiscal data at a specific point in time. It can be used with the Fiscal Data Trend Profile Template (2023) to show trending data on budget source and expenses over multiple years. For a Part C system, the fiscal data profile depicts demographic, service delivery, infrastructure, and administrative […]