The resources and tools below are provided as useful examples only. The DaSy Center is not affiliated with, sponsored by, or endorsing any of the listed resources and tools. For guidance on understanding how modern data visualizationsoftware handles data, visit the Caution: Read the Terms of Use section.
Data Tables Resources
Datawrapper
Datawrapper is a freemium web-based automatic chart-maker. EI and ECSE staff can upload or copy-paste their raw data, and Datawrapper will automatically generate customized charts and maps. Staff can then download visualizations as images or embed them in websites.
Google Sheets
Sheets is a free, web-based spreadsheet application. Its functionality is similar to Excel, although it offers a range of unique tools. Sheets functionality includes real-time collaboration, data exploration through machine learning, and offline editing.
Using Tables as a Method of Data Visualization
Addresses several issues related to the use of data tables, including guidelines for presenting data tables, formatting tables, and embedding data visualizations within data tables
Data Tables Tools
Microsoft Office (Excel)
Microsoft Excel is one of the most widely used software programs for analyzing and visualizing data. Range data can be easily converted to an engaging table suitable for presentation. Conditional formatting and spark lines are key Excel tools that you can use to highlight aspects of your data.
Skill level
Intermediate
Accessing the tool
Microsoft Office, including Excel, is a licensed suite of software that requires purchase (Office 2015 or earlier) or a subscription (Office 365). To get a free 1-month trial, or purchase a monthly subscription or license, go to Try Microsoft Office Page.
General How-To
Creating a table in Excel (Insert-Table) is useful for analyzing data because it allows for easy sorting and filtering. Excel tables, however, are not best for presenting data in a non-interactive form (in a presentation or report). For presentation or report tables, we recommend leaving your data in a range (non-table form) in the Excel spreadsheet and creating your own table by copying the relevant data and pasting the data into a new tab. If you want to filter or sort those data, select the table and click Table Tools at the top of the toolbar and then click Convert to Range in the Tools section.
Tips for Creating Data Tables Excel
Spark Lines
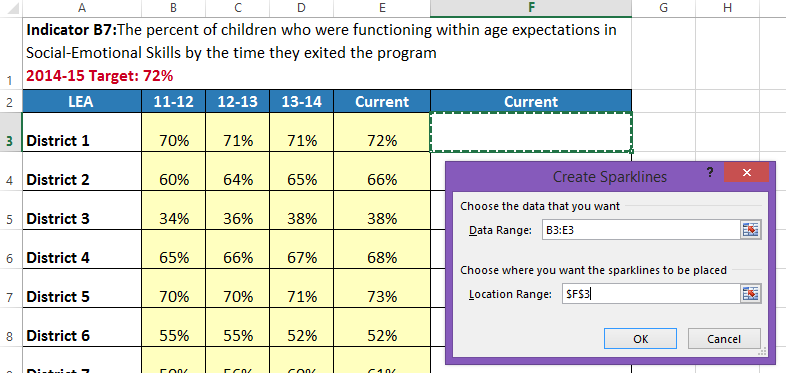
Spark lines (as shown in table 2) are the quickest way to get a glimpse of the shape of your data and evaluate progress over time.
To create spark lines in an Excel data range,
Insert a column after the data you want to summarize.
Click the Insert tab and in the section titled Sparklines, click insert Line
Select the data range (row) you want to create the spark line for and the location range (corresponding cell in your new column).
Click on the spark line to bring up the Sparkline Tools menu at the top. You can then change the markers and color of your spark line, highlight different points, etc.
Drag the spark line cell down to fill the rest of your cells.
Conditional Formatting
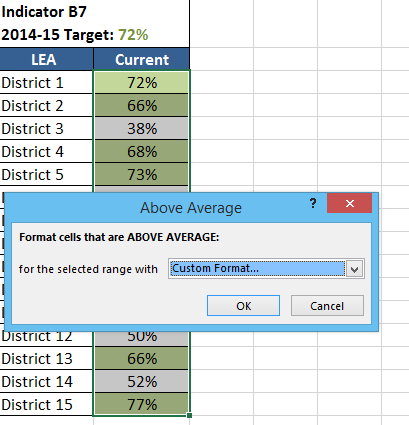
Conditional formatting (as used in table 1) can be used to highlight outliers or concerning data, add visual markers, or create a quick picture of progress toward a target. Below are three ways to use conditional formatting to add detail and interest to a data table.
Highlight Cells. Highlight Cell Rules and Top/Bottom Rules can be used to automatically highlight specific cells in your data that fall above, below, or at a target or benchmark.
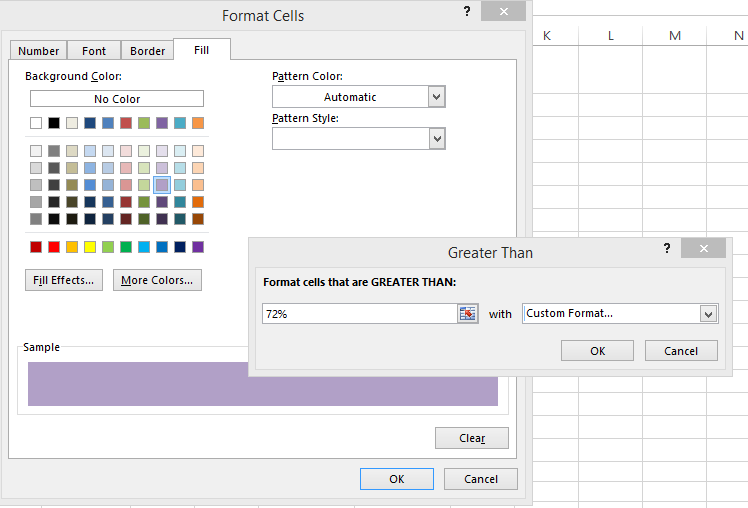
Select the column of data you want to apply a Highlight Rule to. On the Home tab at the top, click the Conditional Formatting icon. Click Highlight Cell Rules and select the rule you want to impose. Tell Excel what values you want to format and how. To customize how the cells are highlighted, click on the drop-down menu and select Custom Format. Under the Fill tab you can select the colors and effects for the cells that are highlighted.
You can also have Excel highlight cells based on some automatic calculations, such as Above Average or Bottom 10% using the Top/Bottom Rules and customize the fill in the same manner.
Use icon indicators. Icons add visual markers to your data. For example, you could add a check mark to indicate observations that meet a target or an X to indicate observations that don’t. When inserting icons, remember that conditional formatting applies only to a column with data; that is, you can’t conditionally format a blank column based on information from another column. Also, the icons will not appear if you copy-paste your data into a Word document or presentation. To insert your table with icons into another document type, you need to paste as a picture. To add a column with an icon, do the following:
Create a new column next to the data you want to apply the icon to and copy-paste the data into the new column.
Select the data in this new column and in the toolbar above, click Conditional Formatting – New Rule.
Under Edit the Rule Description, click on the Format Style drop-down menu and select Icon Sets. You can then choose your icons.
Next to the Icon Style drop-down menu, click on Show Icon Only. This makes the number disappear from the column.
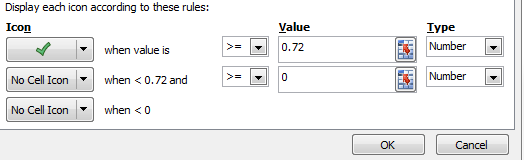
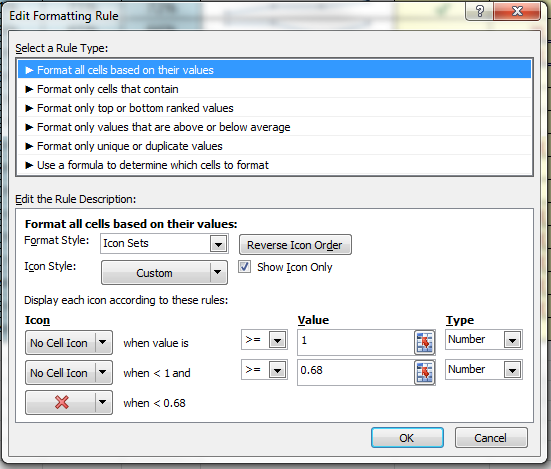
Now you need to determine what rule you want to use to display the icon. For example, you want check marks to indicate all districts with current values greater than or equal to 72%.
For the first line under Display each icon according to these rules, decide which icon you want to show when the cell value is greater than or equal to the target. You can change this by clicking on the drop-down menu under Icon. You want “Type” to be “Number”; then, if you have percentages, the value should indicate the decimal, in this case .72.
For the next two icon rows, you can select No Cell Icon from the Icon drop-down.
Click Ok.
You can edit your rule by selecting the cell and then clicking Conditional Formatting – Manage Rules – Edit Rule.
f. You can use the same process to create a column that indicates X’s for observations below a target. See the following screenshot if you need help:
Create data bars. Using data bars in a table can show how close each observation is to meeting a target, as well as help you compare across observations.
a. Create a new column next to the data you want to apply the data bars to and Copy-Paste the data into the new column.
b. Select the data in this new column and in the toolbar above, click Conditional Formatting – Data Bars and select whichever color/style you like.
c. Select your column of data bars and go to Conditional Formatting – Manage Rules to Edit Rule for additional formatting options.
Add a Data Table to a Chart
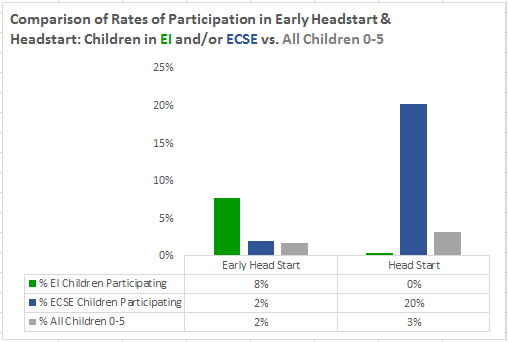
One way to create a data table that includes both a visual presentation and the detailed data is to create a basic chart and add a data table to it.
To add a data table, simply select your chart and then select Chart Tools – Design at the top. Then click Add Chart Element – Data Table to have Excel autogenerate a data table below your chart. You can even automatically combine the key with the data table to reduce chart junk. Download the Excel template.
Figure 1: Example of Chart with Auto-Generated Data Table
Tableau
Tableau is a dynamic tool with many capabilities. Tableau Public is the free version, which has advanced capabilities but requires that all data be public.
Get comfortable with Tableau’s “shelves” system, a drag-and-drop interface for variables. Moving elements to different shelves can dramatically change the display; experiment until you find a good fit.
Experiment with the Color shelf for your data, which includes categorical and gradient features in attractive (and not-Excel!) themes.
Limitations
For the free Tableau Public software, any saved workbooks are available online to the public—so do not use it for confidential data!
For very large datasets or private data services, Tableau requires the purchase of a Tableau plan.
When embedding this application, be aware that applications headings may appear that could be distracting for users.
Updated July 2026.
If you require an accommodation to access any DaSy Resource, please contact DaSy.