A tireless activist and advocate, Judy helped develop legislation that would become the Individuals with Disabilities Education Act (IDEA), and she was a key figure in other federal legislation to increase access and inclusion for people with disabilities.

Compute response rates for your state’s family survey data and determine if the surveys you received are representative of the target population.
DaSy’s State of the States report shows that many early intervention (Part C) and early childhood special education (Part B, 619) state coordinators and data managers are interested in increasing data linking between IDEA programs. We share the story of one state’s journey to link Part C and Part B, 619 data.
Improving programs and changing systems can be hard, DaSy Dynamic Impact is an easy-to-use approach that provides a consistent, successful, and sustainable process to support your team.

Compare your state’s C4 family outcomes data to the national data in the three sub-indicator areas. Make comparisons to subgroups of states that use the same survey and scoring approach
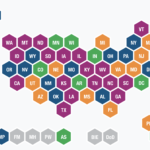
Some states used additional tools/approaches to measure other family variables. States use survey methods to collect family outcomes data, but the questions and processes vary.

December 2022. ECTA and DaSy Center staff discuss the national performance data for indicators C3 and B7, including national data, state variations in performance, and TA resources
Data visualization continues to be a hot topic in all sectors, including education, health care, government, and business. It is essential in helping to interpret data and to communicate information. When we can easily turn data into useful information, it becomes actionable. We hope you use this toolkit to advance this goal in your own work.
Join the Common Education Data Standards (CEDS) Master Class Series, beginning November 17, to learn how to get involved with CEDS, which CEDS tools are right for you, and to learn from your peers.

Data can help Part C and Part B 619 program coordinators, data managers and staff improve outcomes for children and families by strengthening their understanding of the needs of the children and families served and by operating the program more efficiently and effectively.