
Convert your state’s OSEP progress category data for the three child outcomes to the summary statements. This calculator can be used by all states to generate percentages related to the summary statements, regardless of the child outcomes measurement approach.
Tag Archives: Public Reporting
Exploring National Data About Young Children with Disabilities

The purpose of this brief is to increase states’ awareness of national data resources that can support states in sharing, linking, integrating, and using data on young children with disabilities to enhance the provision of early intervention (EI) and early childhood special education (ECSE) services. The audience for this brief includes states’ early childhood leaders working to improve outcomes for young children with disabilities and their families.
Child Outcomes Year-to-Year and Local-to-State Meaningful Differences Calculator

Use this tool to compare child outcomes summary statements across years and compare local child outcomes data to the rest of the state. This Excel-based calculator uses statistical formulas to determine if local and state level differences and the year-to-year differences in summary statements are likely due to factors other than chance (i.e., statistically different).
Timeline of Common Child Outcomes Measurement-Related Activities: Part B Preschool
This tool provides a timeline of common activities that state and local Part B preschool programs undertake to collect and use early childhood outcomes data. The tool presents activities essential for federal reporting as well as other best practices.
Clear, Complete, and Confident: Submitting a Quality APR

This presentation at the 2024 IDIO conference provided information and resources to help states to build a solid understanding of the SPP/APR indicators and the nuances of each calculation. Resources highlighed included the “SPP/APR Basics” online training modules, the Checklists and Tips, and the new Data Calculation documents.
Data for Identifying and Correcting Non-Compliance and Reporting C-12 Findings

The presenters discussed the new requirements for the FFY 2023 Part C SPP/APR submission, including information about reporting C12 data, and the use of pre-finding correction.
IDEA Part C EMAPS Child Count and Settings Data Tool
Designed to provide assistance to IDEA Part C Data Managers and other users of the EDFacts Metadata and Process System (EMAPS). This tool offers a way to ensure accuracy of IDEA Part C Child Count and Settings data prior to official submission. The Part C Child Count and Setting Data Tool allows the state to enter their data and have any errors flagged. Corrections can then be made prior to data entry and submission in EMAPS.
Longitudinal Child Outcomes Summary Statement Graphing Template
This tool can be used to chart the child outcomes summary statements (Indicator C3/B7) over time. It displays trends in child outcomes in the form of line charts, which makes it easy to track progress and interpret the data.
Data Inquiry Cycle
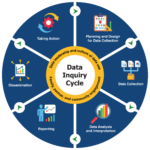
The data inquiry cycle is an iterative sequence of six stages: planning and design for data collection, data collection, data analysis and interpretation, reporting, dissemination, and taking action.
EC Data University – Looker Studio Video Tutorial Series
Overview Data Leadership Competencies Data Foundations Data Analysis Data Use & Sharing Introduction Data Literacy: Evaluating the Implementation of Evidence-Based Practices Looker Studio Video Tutorial Series Using Data to Understand Child Find Systems Using Pivot Tables for Data Analysis Resources Looker Studio Video Tutorial Series Purpose of Series Through this 5-part video tutorial series, you […]