Interpreting year-to-year change in statewide child outcomes data requires understanding the possible reasons for fluctuations. Year-to-Year Changes in State Child Outcomes Data: What Do They Mean? is designed to help […]
Category Archives: 2018
Year-to-Year Changes in State Child Outcomes Data: What Do They Mean?

Interpreting year-to-year change in statewide child outcomes data requires understanding the possible reasons for fluctuations. This brief is designed to help stakeholders learn what questions to ask to understand year-to-year […]
Exploring Pay for Success in Early Intervention
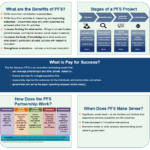
Conference: Conference on Research Innovations in Early Interventions Date: March 2018 Presenters: Grace Kelley, Kathy Hebbeler, Donna Spiker, & Betsy Mercier This poster provides an overview of Pay for Success (PFS), […]
Testing the Validity of Child Outcomes Summary Competency Check

Conference: Conference on Research Innovations in Early Interventions Date: March 2018 Presenters: Katrina Martin, Kathy Hebbeler, Cornelia Taylor, Traci Kutaka, Jessica Hardy, & Amy Nicholas This poster contains information on a […]
State Systemic Improvement Plans: Progress and Lessons Learned Thus Far
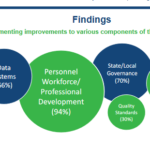
Conference: Conference on Research Innovations in Early Interventions Date: March 2018 Presenters: Kathleen Hebbeler, Abby Schachner, & Grace Kelley As part of national efforts to improve state systems, practices, and outcomes […]
Updated data governance resources!
We’ve added new sections on Data Requests and Electronic Communications to our Data Governance and Management Toolkit. Learn about important data considerations for responding to data requests and governing the […]
Strengthening SSIP Evaluations with Qualitative Methods

This 2018 report provides a broad overview of what qualitative research methods are, as well as examples and suggestions for collection high-quality qualitative data. Additionally, the report offers examples of […]
The Perils of Confusing Performance Measurement with Program Evaluation

A group of researchers recently published a paper critiquing the child outcomes performance indicator for Part C and Part B 619. They also presented some of their thoughts in a […]
Child Outcomes Reports – Special Collection
Topics » Child Outcomes Reports This online resource collection provides a convenient means to access a variety of child outcomes data reports that states have produced for their local programs. […]
Fiscal Data Profile Template for Part C Systems
The DaSy/ECTA Fiscal Data Profile Template is an easy-to-use tool for displaying fiscal data reflective of the state Part C system. The Excel template converts raw program-level fiscal data that […]

