
The SLDS Technical Assistance program is offering a virtual group for states who are working to determine how they will calculate the preschool count required under ESSA. Those responsible for the state plan and those who will be calculating the preschool count are encouraged to join these discussions. The group will meet virtually once a […]
Category Archives: 2018
Introducing the Stakeholder Knowledge Toolkit
Check out our Stakeholder Knowledge Toolkit, which provides Part C and Part B 619 stakeholders with an orientation to IDEA data and other data-related topics to help them meaningfully participate in conversations about important programmatic issues and decisions.
Fiscal Data Profile Template (2018)
This Fiscal Data Profile Template (2018) displays fiscal data at a specific point in time. It can be used with the Fiscal Data Trend Profile Template (2023) to show trending data on budget source and expenses over multiple years. For a Part C system, the fiscal data profile depicts demographic, service delivery, infrastructure, and administrative […]
SSIP Evaluation Collection: State SiMR statements
State Systemic Improvement Plan (SSIP) Phase III Year 1 State Identified Measureable Results Statements and Reports lists each state’s selected child or family outcome that they are working to improve through their State Systemic Improvement Plan (SSIP). Thanks to our partners at ECTA Center for creating this useful webpage!
State Systemic Improvement Plan (SSIP) Phase III Year 1 State Identified Measureable Results Statements and Reports

This 2018 webpage lists each state’s selected child or family outcome that they are working to improve through their State Systemic Improvement Plan (SSIP). The outcome that the state has selected is referred to as their State-identified Measureable Result(s) (SiMR). SIMR statements have been excerpted from state Phase III, Year 1 SSIP reports submitted to […]
Guidance document on creating SSIP infographics
Telling Your SSIP Story in an Infographic: Strategies, Tips, and Examples offers guidance on the varied uses/audiences for infographics, best practices for creating infographics, and examples of state SSIP infographics. It also offers an exemplar SSIP infographic and instructions for how to access the template through a TA provider.
Telling Your SSIP Story in an Infographic: Strategies, Tips, and Examples

This 2018 brief offers guidance on the varied uses/audiences for infographics, best practices for creating infographics, and examples of state SSIP infographics. It also offers an exemplar SSIP infographic and instructions for how to access the template through a TA provider. Published by: DaSy Center, National Center for Systemic Improvement (NCSI), and ECTA Center Telling […]
Toolkit: Including IFSP Information in Your Part C Data System
In planning a new data system or enhancing an existing system, one important decision for Part C programs is determining what, if any, IFSP data to include in the system. With our toolkit, Including IFSP Information in Your Part C Data System: Selected Features and Related Functionality, states can learn about the data system features […]
Introduction to Self-Assessment Comparison Tool
This 5-minute video is designed to help you get starting with using the Excel-based Self-Assessment Comparison Tool to examine changes over time in the implementation of the ECTA and DaSy System Frameworks.
Introduction to Self-Assessment Comparison Tool
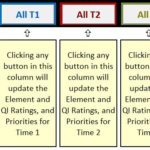
This 2018 video is designed to help you get starting with using the Excel-based Self-Assessment Comparison Tool to examine changes over time in the implementation of the ECTA and DaSy System Frameworks. This 5 minute video offers instructions and demonstrations of the tool. More detailed instructions are available in the Guidance for Using the Self-Assessment […]