Category Archives: 2018

Identify Meaningful Differences in Child Find

This Excel-based calculator allows states to make several comparisons related to the percentage of infants and toddlers served: State percentage compared to state target, local program percentage compared to state target, and year-to-year comparisons of the state percentages. It also computes confidence intervals to determines whether the difference between the two numbers is large enough […]

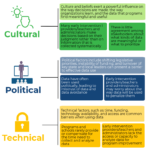
Barriers to Data Use

This DaSy-developed infographic identifies the cultural, political, and technical barriers that research has identified as impacting data use. View Barriers to Data UseInfographic or text-only version

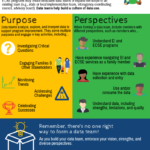
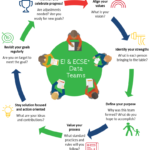
What are Data Teams?

Whether starting a new internal data team or requesting support from an existing external group, this DaSy-developed infographic can be used to recruit data team members to give them an overview of data teams, how they operate and why multiple perspectives are so important to the success of the effort; or to raise awareness to […]