DaSy Center
Skip to content
  • About
  • Webinars & Conferences
  • Resources
  • Technical Assistance

DaSy Center

Tags

Data Visualization, Technology


Categories

2018, IDIO 2018 Conference

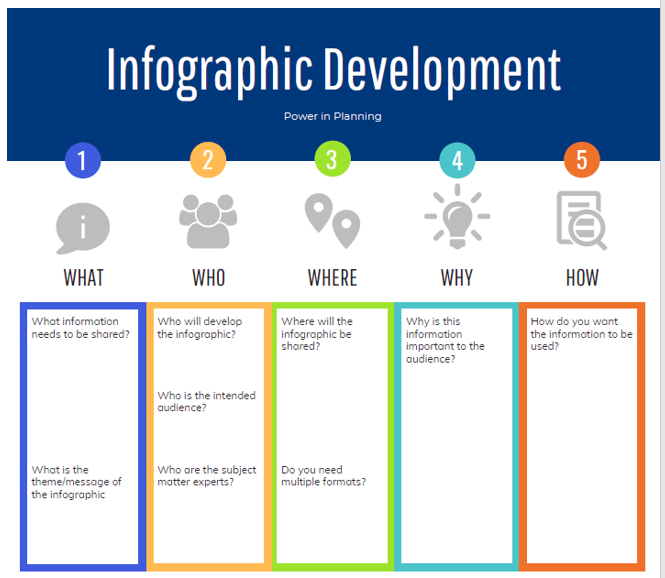
Infographic Development chart image

Telling Your Data Story with an Infographic

October 2, 2018 by Stephany Garcia

Infographics quickly tell a story using data to a wide variety of audiences. This presentation will share resources and best practices for creating effective infographics and provide guidance for how to create an infographic from start to finish.

Published by: DaSy

Telling Your Data Story with an Infographic

If you require an accommodation to access any DaSy Resource, please contact DaSy.
Top of Page | Print this page
Logo: DaSy. The Center for IDEA Early Childhood Data Systems

HOME | ABOUT | ACCESSIBILITY | CONTACT US


This website and DaSy products were developed under a grant from the U.S. Department of Education, #H373Z190002. The contents and resources do not necessarily represent the policy of the U.S. Department of Education, and you should not assume endorsement by the Federal Government. Project Officers: Meredith Miceli and Amy Bae.

Copyright © 2013-2022 SRI International. All rights reserved.

Logo: SRI Education. A Division of SRI International.
Logo: Ideas that Work. U.S. Office of Special Education Programs