
DaSy and ECTA staff discuss FFY 2020 results from the Indicator C4 Family Outcomes data, including state approaches to surveys, data quality, performance trends, and resources.
Part C Indicator 4: Family Outcomes Data FFY 2020
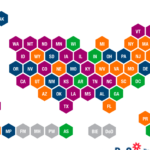
DaSy and ECTA staff discuss FFY 2020 results from the Indicator C4 Family Outcomes data, including state approaches to surveys, data quality, performance trends, and resources.

For a Part C system, the fiscal data profile depicts demographic, service delivery, infrastructure, and administrative data in a variety of ways to make the fiscal data more comprehensible to users.

Data linking is often necessary to address critical questions about program quality and to improve results for young children with disabilities and their families. Yet data linking can be challenging. Learn about ways to streamline this process.
Topic 4: Fiscal Management DMS Topical Working Series starts Friday, September 15, 2023 (2:00 – 4:00 ET). Please apply no later than Tuesday, August 22, 2023. Apply here! Learn more about Topic 4: Fiscal Management. The OSEP TA centers, ECTA, DaSy, CIFR, and CADRE, are collaborating to provide four separate DMS topical working series for […]

This webinar will show attendees how to navigate Communities360 and the IES/NCES website to find valuable resources that are available to assist with planning, implementing, and maintaining SLDS.

Compare your state’s C4 family outcomes data to the national data in the three sub-indicator areas. Make comparisons to subgroups of states that use the same survey and scoring approach
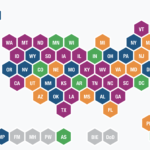
Some states used additional tools/approaches to measure other family variables. States use survey methods to collect family outcomes data, but the questions and processes vary.

A document that includes information about each of the fields included in the COS-KC All Data report. If you need more information, contact your DaSy TA liaison. COS-KC Data Key for All Data Report Published May 2023.

November – December 2022. Are you looking for better ways to share your publicly-reported data with stakeholders? Do you wish you had access to an easy-to-use tool to help you create engaging data displays?