
This Fiscal Data Profile Template (2018) displays fiscal data at a specific point in time. It can be used with the Fiscal Data Trend Profile Template (2023) to show trending […]
Fiscal Data Profile Template (2018)
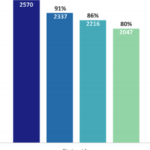
This Fiscal Data Profile Template (2018) displays fiscal data at a specific point in time. It can be used with the Fiscal Data Trend Profile Template (2023) to show trending […]

This 2018 brief offers guidance on the varied uses/audiences for infographics, best practices for creating infographics, and examples of state SSIP infographics. It also offers an exemplar SSIP infographic and […]

This webinar introduces a new resource, the Local Child Outcomes Measurement System (L-COMS). The L-COMS can support local programs, such as Early Intervention programs or school districts, in examining and […]

Conference: 2017 OSEP Leadership Conference Date: July 2017 Presenters: Mary Anketell, Dina Stipetic, Laura Hudson, & Kerry Belodoff This poster displays information on building capacity for local data inquiry, analysis, […]
The final of three 30 minute data visualization talks, this webinar focuses on how to effectively create and use infographics and answers 3 key questions: How can infographics be useful? […]

The second of three 30 minute data visualization talks, this webinar focuses on effectively presenting data using animation and presentation tools. Presenters will walk the audience through the process of […]
This third of three mini-webinars presented during Linking Week 2017, reviewed lessons learned from the week and shared resources and supports that address specific data linking needs. Presented by Sharon […]

In this first of three 30 minute data visualization talks, presenters defined data visualization and addressed 5 common pitfalls when creating charts: Not clearly articulating your message; beginning with the […]

Conference: Division for Early Childhood’s (DEC) 32nd Annual International Conference on Young Children with Special Needs and Their Families Date: October 2016 Presenters: Kerry Belodoff, Darla Gundler, Amy Nicholas, & […]
Conference: STATS-DC Date: July 2016 Presenters: Kerry Belodoff, Taletha Derrington, & Alice Ridgway This session introduces the new DaSy-NCSI Data Visualization Toolkit. The toolkit identifies key design principles, data considerations, […]