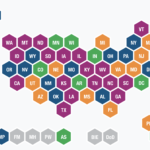
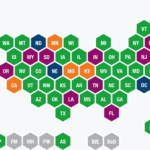
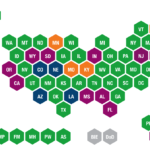
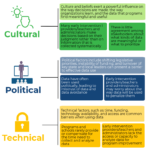
Category Archives: Infographic

Arizona Part C SSIP Infographic

(blank)

This state-developed infographic describes Arizona’s Early Intervention Program, identifies its State-identified Measurable Result (SiMR), Theory of Action, and Infrastructure Improvement Strategies. It also shows how Arizona’s Team Based Early Intervention […]

Barriers to Data Use

This DaSy-developed infographic identifies the cultural, political, and technical barriers that research has identified as impacting data use. View Barriers to Data UseInfographic or text-only version

What are Data Teams?

Whether starting a new internal data team or requesting support from an existing external group, this DaSy-developed infographic can be used to recruit data team members to give them an […]