Category Archives: Infographic

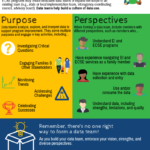
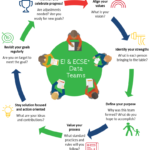
What are Data Teams?

Whether starting a new internal data team or requesting support from an existing external group, this DaSy-developed infographic can be used to recruit data team members to give them an overview of data teams, how they operate and why multiple perspectives are so important to the success of the effort; or to raise awareness to […]

Where are the Data?

Data system icon with four arrows pointing inward from outside

This infographic from DaSy’s 2017 Focus on Linking Part C and Part B 619 Data week offers illustrations of four different scenarios for housing Early Intervention (EI) and Early Childhood Special Education (ECSE) data in a state. It can be a useful tool to share when approaching conversations with data partners about linking.

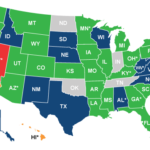
State of the States on Linking Data

map-child-level-elements-2016

This infographic from DaSy’s 2017 Focus on Linking Part C and Part B 619 Data week offers data from our 2015 state survey on which states are linking EI and ECSE data, what proportion of states use the same unique child ID for both EI and ECSE programs, and how EI and ECSE programs are […]

Answer the Question!

DaSy center logo with question mark

What people think of as the moment of discovery is really the discovery of the question. – Jonas Salk Questions—ones that get at important topics that are meaningful to Early Intervention (EI) and Early Childhood Special Education (ECSE) state agencies—are often at the heart of Part C and 619 coordinators’ and Part C and B […]