
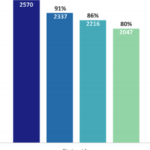
October 9, 2018 In this webinar, ECTA and DaSy staff discussed results from the latest national child outcomes analysis. They reviewed national estimates, state variations in performance, and provided a […]
National Child Outcomes Results
October 9, 2018 In this webinar, ECTA and DaSy staff discussed results from the latest national child outcomes analysis. They reviewed national estimates, state variations in performance, and provided a […]

This webinar explored DaSy’s new Data Culture Toolkit, following the five key steps to building a culture of data use in a state or local program: Formalize your data team […]

This Excel-based calculator allows states to make several comparisons related to the percentage of infants and toddlers served: State percentage compared to state target, local program percentage compared to state […]

Interpreting year-to-year change in statewide child outcomes data requires understanding the possible reasons for fluctuations. This brief is designed to help stakeholders learn what questions to ask to understand year-to-year […]

This 2018 report provides a broad overview of what qualitative research methods are, as well as examples and suggestions for collection high-quality qualitative data. Additionally, the report offers examples of […]
This Fiscal Data Profile Template (2018) displays fiscal data at a specific point in time. It can be used with the Fiscal Data Trend Profile Template (2023) to show trending […]

Developed by ECTA and DaSy, this document is designed to illustrate how a state might summarize and report data gathered through the System Framework self-assessment process to document infrastructure improvements […]

This webinar introduces a new resource, the Local Child Outcomes Measurement System (L-COMS). The L-COMS can support local programs, such as Early Intervention programs or school districts, in examining and […]
The final of three 30 minute data visualization talks, this webinar focuses on how to effectively create and use infographics and answers 3 key questions: How can infographics be useful? […]

The second of three 30 minute data visualization talks, this webinar focuses on effectively presenting data using animation and presentation tools. Presenters will walk the audience through the process of […]