
States receiving funds to implement the Individuals with Disabilities Education Act (IDEA) must develop a State Performance Plan (SPP) that describes their efforts to meet the requirements and purposes of IDEA, as well as an Annual Performance Report (APR) that reports on their performance. Completing the SPP and APR relies on the collection and use of a variety of data, including some IDEA Section 618 data (e.g., the number of children served, educational environments or settings in which children receive services).
In this section, you will learn about:
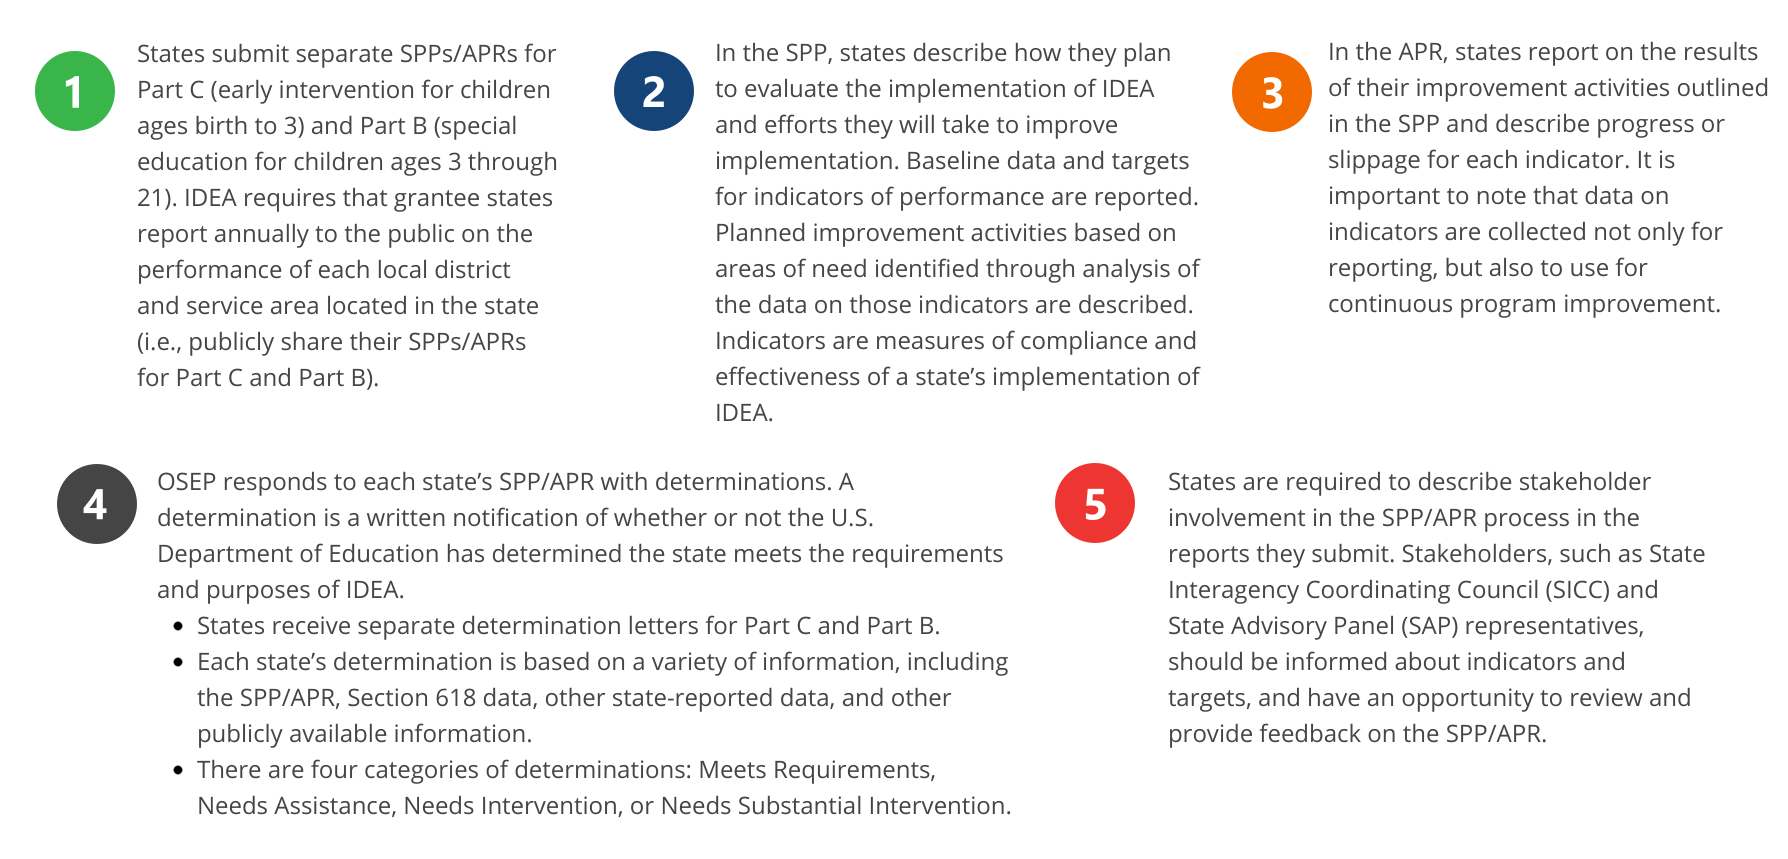
- the types of data required to be included in the State Performance Plan/Annual Performance Report (SPP/APR);
- how the information in the SPP/APR is used by states and the federal government to monitor the implementation of IDEA programs; and
- where to locate and how to ask questions about your state’s SPP/APR data.
Download a PDF version of this section: What do I need to know?
How do I apply this to my state?
Drawing meaning from SPP/APR data takes practice, and reviewing all of the data in an SPP/APR is a large undertaking! To strengthen your understanding of your state’s data, you can start by focusing on one indicator: Child outcomes (Part B Indicator 7 and Part C Indicator 3).
- Find your state’s SPP/APR on Grads 360. Choose Part B or Part C, the most recent year, and your state. Click on your state and then click on the child outcomes indicator (Part B Indicator 7 or Part C Indicator 3).
- Review the descriptions provided in the Measurement section on the page (e.g., progress categories, summary statements).
- Now look at the Targets section to examine trends over time in the state meeting its targets for the child outcomes indicator.
- The rows for A1 and A2 show data on Outcome 1 (Positive Social-Emotional Skills), rows for B1 and B2 are on Outcome 2 (Acquisition and Use of Knowledge and Skills), and rows for C1 and C2 on Outcome 3 (Use of Appropriate Behaviors to Meet Needs).
- A1 and A2, B1 and B2, and C1 and C3 refer to the Summary Statement association with each outcome.
- Summary Statement 1: Of those children who entered the program below age expectations in each outcome, the percent who substantially increased their rate of growth by the time they exited the program.
- Summary Statement 2: The percent of children who were functioning within age expectations in each outcome by the time they exited the program.
- Answer the following questions using the reported data:
- For the most recent year, did the state meet the targets set for each summary statement for each outcome area? If not, in which outcome area(s) or summary statement(s) were the targets not met?
- Were there differences in performance on this indicator from last year to this year?
- Are there noticeable trends in the data over 3 or more years? For example, is the state consistently meeting targets in one outcome area or one summary statement, but not the others?
- Dig deeper into exploring your state’s child outcomes data by talking with your Part C or Part B lead agency partners about the state’s data collection procedures:
- How and when does the state collect child outcomes data from local programs?
- What data instrument or method is used? What are the strengths and limitations of this instrument or method?
- Who is involved in collecting the data? Do families contribute to the data collection process?
- Use the questions from this activity as a guide to explore the data associated with other indicators in your state’s SPP/APR, such as the State Systemic Improvement Plan (SSIP) Part B Indicator 17 and Part C Indicator 11) or the settings in which young children receive services (Part B Indicator 6 and Part C Indicator 2).
What are some related resources?
- The Story of Data: An Early Childhood Tale and The Story of Data: A Special Education Tale. These short videos developed by the IDEA Data Center are engaging animated stories that show how data inform decisions about programming for children with developmental delays and disabilities and their families.
- National data analyses: Each year, the Early Childhood Technical Assistance (ECTA) Center analyzes and reports national summaries of child outcomes data for Part C (Indicator C3) and Part B (Indicator B7), and family outcomes for Part C (Indicator C4).