
 Download Tip Sheet 4:
Introduction
Data on practice implementation can be used to improve practice. Decision-makers at different system levels need different kinds of information. For example, local program personnel make decisions about the supervision, supports, and resources practitioners need to implement practices with fidelity and therefore require data at the practitioner level. State administrators and other state-level stakeholders need data summarized at the program or regional level to identify variation in programs’ successes and challenges to provide appropriate supports where needed.
Decision-makers at all levels need information that they can understand and act on. Too much data can be overwhelming and counterproductive. A useful strategy for analyzing data on practitioners’ implementation of evidence-based practices is to collapse data collected at the local level on individual practitioners into concise data summaries. The goal is to represent all practitioners or programs involved in the improvement efforts in a single or a few data points to provide meaningful and actionable information for decision-makers.
Strategies for Summarizing Data
The following strategies can help states and programs summarize data for decision-makers:
- Using summary scores. A typical practice implementation tool has many items to measure multiple components of an evidence-based practice that can be combined into one summary score. A coach or program administrator may examine performance on the individual items to identify practitioners’ strengths and areas for improvement. For decision-makers at the program, regional, or state levels, summary scores are often more useful to detect patterns across practitioners and organizational units such as schools, programs, and regions.
- Summarizing by practice area or domain. Many tools provide subscale scores in addition to a total score for the entire tool. These subscale scores can provide valuable insight into each component of the practice and highlight areas of strength or need at a more global level than individual items. Subscale scores can be aggregated across programs and practitioners to indicate variation in implementation of the various components that make up the practice.
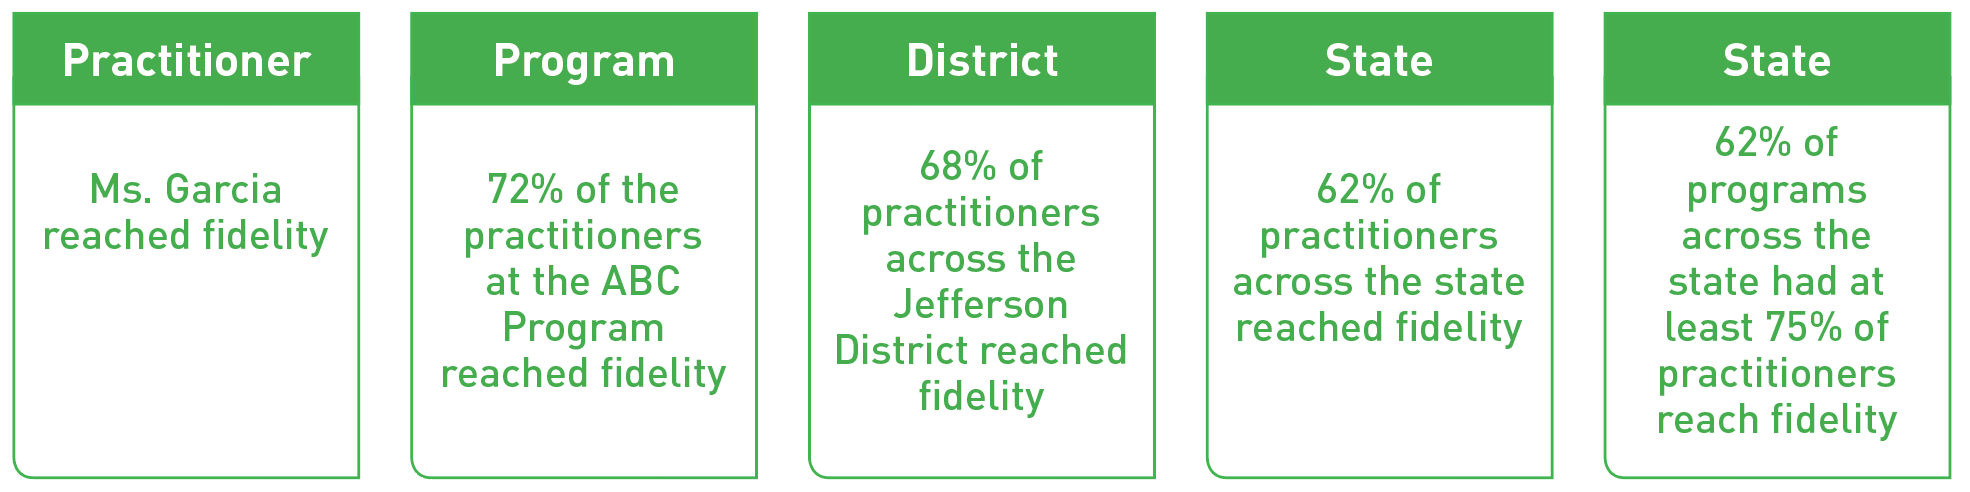
- Aggregate data. Aggregating or rolling up summary or component scores for individual practitioners to higher organizational units (e.g., program, state) facilitates the use of data for decision-making at various system levels. The figure below illustrates how a single set of data (from practitioner-level fidelity measures) can be summarized at different levels for different purposes.
Data Aggregation Example—Practitioner Fidelity Scores
The following table presents example methods for aggregating data on practice implementation.
| Aggregation Method and Data Summary Example | Considerations | Calculation |
|---|---|---|
| Percentage of practitioners with improved scores Scores on the Home Visiting Rating Scales-Adapted and Extended (HOVRS-A+) increased between the fall and spring assessments for 72% of the practitioners. |
Can provide a sensitive measure of small increments of progress, but small improvements might not be meaningful. Consider developing criteria for designating scores as “improved” (e.g., increase of 5 points, category change from “emerging” to “partially implementing”). | 1. Calculate change for each individual across 2 time points: Time 2 Summary Score minus Time 1 Summary Score. Note that a positive score means that practitioners’ performance improved; a negative score indicates performance declined. 2. Calculate the percentage of practitioners with a positive score: # of practitioners with positive score/total # of practitioners with a score |
|
Percentage of practitioners meeting fidelity threshold 64% of teachers were implementing the family engagement practices with fidelity. |
May take time to see increases in the percentage of practitioners meeting fidelity; use in conjunction with the above approach to assess progress toward fidelity | 1. Determine whether each practitioner met the threshold. 2. Calculate the percentage of practitioners meeting the fidelity threshold: # of practitioners that met fidelity/total # of practitioners with a fidelity score 3. Compare this percentage with other time points to see if it is increasing over time. |
| Percentage of programs meeting performance indicator for practitioner fidelity 60% of programs had at least 75% of practitioners meeting fidelity of implementation of the Pyramid Model by May 2018, as measured by the Teaching Pyramid Observation Tool. |
Need to establish performance indicator for the percentage of practitioners implementing with fidelity (e.g., 75% of practitioners within a program meet fidelity by May 2018). | 1. Determine whether each practitioner met the threshold. 2. Calculate the percentage of providers meeting the fidelity threshold for each program: # of practitioners from the program that met fidelity/total # of practitioners from the program with a fidelity score 3. Calculate percentage of programs where percentage of practitioners reaching fidelity meets the performance indicator (e.g., 75%): # of programs that met performance indicator (e.g., 75% of practitioners reaching fidelity)/total # of programs |
Using and Sharing Data
With actionable data on practice implementation, decision-makers can identify successes and challenges and make adjustments to achieve intended outcomes. To get the most from your data:
- Discuss the findings. Bring people together to discuss data on practice implementation. Ask questions: What patterns do you see? Are the results what you expected? What are the implications of the findings for our work?
- Engage stakeholders. Stakeholders, particularly practitioners and families, provide important perspectives on practice implementation and can help identify next steps toward achieving desired changes.
- Display data in engaging ways. Use charts, infographics, and other data visualization techniques to increase engagement and understanding
Resources
- Data Meeting Protocol (IDEA Data Center, 2018).
- The DaSy Center’s Data Visualization Toolkit
- The DaSy Center’s Data Culture Toolkit
The contents of this tool and guidance were developed under grants from the U.S. Department of Education, #H326P120002 and #H373Z120002. However, those contents do not necessarily represent the policy of the U.S. Department of Education, and you should not assume endorsement by the Federal Government. Project Officers: Meredith Miceli, Richelle Davis, and Julia Martin Eile.