
 Download Tip Sheet 5:
Introduction
This tip sheet provides guidance on preparing for and conducting data analyses for program improvement and is intended to be used by program staff and interested stakeholders to inform the process. See DaSy Framework: Data Use for more resources on using data for program improvement. Analyzing data on implementation of evidence-based practices is an important, iterative process that can help you understand how well practitioners are supporting children and families. A key component of the process is engaging with families, providers, and other key stakeholders to understand their perspectives and the questions they want to answer. The results of the analysis process can provide information about whether practitioners are reaching fidelity—implementing the practice as intended—and/or improving implementation over time. In addition, examining variation in practitioner performance by components of the practice, or practitioner or program characteristics can point to areas of strength, as well as areas where supports are needed to improve workforce capacity and sustain implementation.
While this tip sheet focuses on analyzing quantitative or numerical data, analyzing qualitative data on implementation, such as interviews and focus group data, can help you understand practitioner and other stakeholder experiences and implementation contexts. Information gathered from qualitative data can help you interpret related quantitative data. See Strengthening SSIP Evaluations with Qualitative Methods for guidance on using qualitative data.
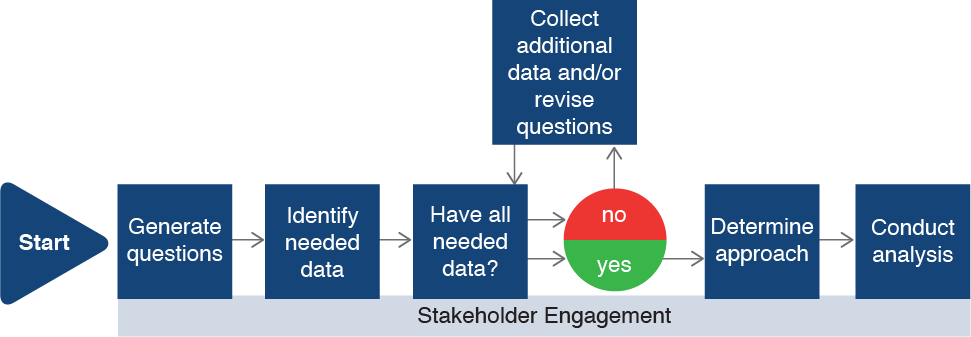
Creating an analysis plan is a critical first step in conducting high-quality analyses that support decision-making. Steps to create this plan include generating the analysis questions that you and key stakeholders would like to answer, identifying data relevant to those questions, and determining the analysis approach. With this plan, you will be ready to conduct meaningful analyses. If you find you do not have all the data you need to answer your questions, you may need to collect additional data and/or revise your questions. This process is summarized in the figure below and described in this tip sheet.
Generate Your Analysis Goals and Questions
Think about what you need to know to improve the delivery of the evidence-based practice you are evaluating. Tap into your own ideas and those of stakeholders about what is working and what improvements might be needed.
- Ask stakeholders such as families, direct service providers or practitioners, trainers, and policymakers what they want to know. Then use what you learn through the stakeholder engagement process to inform what you will try to accomplish through the analysis process. These are your analysis goals.
- If you have key staff such as a data manager, or program staff, and other decision makers, gather your team so you can determine goals and generate questions together.
- Translate your goals into simple (one- or two-part) analysis questions that include a success metric, or a way to measure progress. The table below has analysis questions associated with example goals related to fidelity of implementation – whether practitioners are meeting established fidelity thresholds (see Tip Sheet 3 of this series, Establishing a Fidelity Threshold), practice change – whether practitioners are improving in their implementation over time and variation in fidelity or practice change – whether implementation varies by practice components or program or practitioner characteristics.
Example Analysis Goal
|
Associated Analysis Question |
|---|
| …if practitioners are meeting the fidelity thresholds we set. | What percentage of practitioners are meeting the fidelity threshold on the XYZ measure of the practice?
How do average practitioner scores on XYZ measure compare to the fidelity threshold?
|
| … if practitioners are improving in their implementation of the practice. | Do practitioner scores on the measure improve over time? |
| … if some components of the evidence-based practice are easier or harder for practitioners to implement.
…what topics to prioritize for upcoming trainings and other professional development. |
Do practitioner fidelity or practice change scores vary by component of XYZ measure? |
| …if more practitioners are reaching fidelity in some regions than in other regions. | Do practitioner scores vary by geographic region? |
| … whether practitioner scores vary by practitioner education or experience. | Do practitioner scores vary by their length of time in their position? Do practitioner scores vary by their discipline-specific training? Do practitioner scores vary by practitioner education level? |
| …which programs need support to improve practice implementation. | Do practitioner scores vary by program? |
Identify Data Relevant to Your Questions
Look at the data you have available and consider which data might help answer your questions.
- Implementation data. Determine what data are available on fidelity of implementation or practice change. Do you have access to scores by practice component, by individual practitioner, by region, by program, or by trainer or coach?
- Contextual data. Consider additional data you have to help you understand factors that may be influencing the scores. For example, what data do you have on practitioners (e.g., how long they have implemented the evidence-based practice, trainings completed on the practice, length of time in their current position) and programs (e.g., supports available to practitioners, how long the program has been implementing the practice, populations served)? This may require linking to other data sources such as workforce or training data.
Once you have identified available data, revisit the analysis questions with families, staff, and other stakeholders to make sure you have all the data you need. If not, you may need to revise the questions or obtain additional data.
Determine Your Analysis Approach or Method
Your analysis approach will depend on your analysis goals and questions.
Examining Fidelity of Implementation or Practice Change. Look at practitioner scores from your assessment of practice implementation at a single time point to determine whether the scores reach your designated fidelity threshold, if you have one. Examine practitioner scores across time to determine if implementation is improving. Below are example analysis approaches or methods for these types of questions.
| Examining Fidelity of Implementation | Example |
|---|---|
| Compute the number of practitioners reaching the established fidelity threshold. | Arrange practitioner scores in numerical order and count or sum the number of scores that meet or exceed the fidelity threshold. |
| Compute the average or mean practitioner score and compare it to the fidelity threshold. | If your fidelity threshold is 80 (out of 100), an average score of 65 indicates that the average practitioner is not reaching fidelity. |
| Compute the percentage of practitioners reaching the fidelity threshold. | Divide the number of practitioners reaching fidelity by the number included in the fidelity assessment. For example, “68% (61 out of 90) of practitioners reached fidelity.” |
| Examining Practice Change | Example |
| Compute a change score by subtracting practitioners’ scores at time point 1 from those at time point 2. | Compare average pre-training scores with average post-training scores to see if, on average, scores increased, decreased, or stayed the same, or count the number of practitioners whose post-training scores increased, decreased, or stayed the same within a certain timeframe after the training. |
| Compare the average change scores or percentage of practitioners improving their scores from different cohorts or groups | Compare change within 6 months of training for two different cohorts (e.g., the first cohort of practitioners trained compared with the next or most recent cohort). |
| Note: If you have more than two time points, consider comparing each practitioner’s earliest score with their most recent score to look at overall change, or mid-point score with latest score to examine recent change. | |
Examining Variation in Implementation. Disaggregating, or examining the data by smaller components such as practitioner, program, or regional characteristics can help you learn about what might be contributing to variation in practitioner scores. Identifying factors that support fidelity of implementation or practice change can help you determine how to sustain or improve implementation.
Using the same analysis approach or method described in the table above, examine fidelity of implementation or practice change scores for different groups of practitioners or practice components. Depending on what data you have available, compare scores by:
- Practitioner characteristics such as experience, level of training, education, race/ethnicity, or primary language
- Program or regional characteristics such as administrative structure, program size, program resources, average caseload, urban or rural, community poverty
- Training provider or coach
- Components of the evidence-based practice
- Subscales of a tool measuring the practice
As you identify characteristics of practitioners with lower scores, or practice components that seem to be more difficult than others, you can determine where changes may be needed to better support practitioners (e.g., adding training or coaching supports). For example, you may find that practitioners in programs offering fewer training hours are less likely to meet fidelity thresholds compared to practitioners in programs providing more training hours. Looking deeper, you may find that programs offering fewer training hours receive less funding to support training and have limited access to qualified trainers. Examining the equitable distribution of resources and supports for implementation is just one reason to consider disaggregating the data. This approach can help you find variation in practice implementation, identify factors associated with variation, and identify systemic inequities that may be contributing to that variation (see We All Count website and 6 Steps to Equitable Data Analysis for additional resources on equity).
Considerations for Conducting the Analysis
After you have created an analysis plan by generating analysis questions, identifying all necessary data, and determining the analysis approach or method, it’s time to carry out the plan.
- Document the process. Documentation can be important as you interpret the results, consider additional analyses, and plan for similar analyses in the future. If you are not conducting the analyses yourself, request that the data analyst provide you (or the team) with documentation of sample size, methods, and limitations of the process. See the DaSy/ECTA resource Planning, Conducting, and Documenting Data Analysis for Program Improvement for more on this topic.
- Revisit analysis goals. Go back to your analysis goals and questions to see if the analysis met the goals that you identified with stakeholders. Conduct additional analyses to answer original questions or add to or revise the original questions. As you consider additional analyses, consider those that might be accomplished in the near term and those that you might want to do later.
- Apply the results. Consider how to help your team use the results, including communicating the results to stakeholders in accessible and engaging ways. The DaSy Data Culture Toolkit includes resources to support this and other parts of the process. See the Resources section of this tip sheet for additional links that might be helpful in your preparation and analysis.
Conclusion
The iterative process of developing and implementing an analysis plan can highlight areas of strength in practitioners’ implementation of evidence-based practices and identify where supports might be needed to build workforce capacity. The results of your analyses can be part of a continuous quality improvement cycle where you collaborate with stakeholders to use data to inform program improvement and then examine additional data to see if the improvement efforts enhanced implementation.
Additional Resources
- Are You Turning Data into Insight?
- Preparing for Your Next Virtual Stakeholder Meeting
- Stakeholder Knowledge Toolkit
- Tip Sheet 4: Summarizing Data for Decision-Making provides information about scenarios where you might need to summarize data from multiple sources or time points and includes information about how to calculate a summary score.
The contents of this tool and guidance were developed under grants from the U.S. Department of Education, #H326P120002 and #H373Z120002. However, those contents do not necessarily represent the policy of the U.S. Department of Education, and you should not assume endorsement by the Federal Government. Project Officers: Meredith Miceli, Richelle Davis, and Julia Martin Eile.