
This tool can be used to chart the child outcomes summary statements (Indicator C3/B7) over time. It displays trends in child outcomes in the form of line charts, which makes it easy to track progress and interpret the data.
Category Archives: Spreadsheet
619 Child Outcomes Data Completeness Calculator
This 619 Child Outcomes Data Completeness Calculator is an Excel-based analytic tool that can be used to determine the percent of children exiting the program with complete child outcomes data […]
Excel calculator for computing the Number and Percentage of Infants and Toddlers who did not Receive Early Intervention Services for at Least Six Months

This Excel tool can be used to compute the difference between valid entry and exit dates for children receiving early intervention services and count the number of children with less […]
Identify Meaningful Differences in Child Find

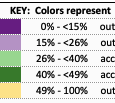
This Excel-based calculator allows states to make several comparisons related to the percentage of infants and toddlers served: State percentage compared to state target, local program percentage compared to state […]
Early Childhood Outcomes Data Summaries
This template for Part B can be used to create charts when data is entered to show the difference from target and the difference from the previous year for 3 […]
Arizona Early Intervention Program Child Outcomes Report

This sample Part C report is in the form of a spreadsheet with information including bar graphs for progress categories, outcome distributions at entry and exit, and summary statements. Instructions […]