
A dashboard is a visual display of the important information needed to achieve one or more objectives, arranged on a single screen so the information can be monitored at-a-glance (Source: Dashboard Insight). Dashboards help providers and administrators manage their work; they can cover broad or specific aspects of a program. As used in Part C data systems, they often make available simple reports that display in real-time key metrics or performance indicators, such as the number of children on a service coordinator’s caseload. Dashboards are often the main or home page of a data system, and may include other types of information, such as: a notification (alert) or tickler system to notify users of tasks coming due; a calendar system; or a message board. The information for this feature concerns the use of dashboards with IFSP-related content, but dashboards are equally applicable to other aspects of the service system (e.g., referral or eligibility determination).
Connection to DaSy Data System Framework:
System Design and Development QI4: The Part C/Part B 619 state data system has the capacity to support accountability, program improvement, and program operations.
Potential Data Elements
By way of example, the data elements below could be included in a dashboard that identifies, for a service coordinator, the number of children in various phases of the service system.
- Number of children in referral
- Number of children in eligibility determination
- Number of children enrolled (with IFSP)
- Number of children exiting
Functionality
- User interface
- Summary reports
- Lists of tasks due
- Notifications/alerts
- Calendaring system
- Message boards
- Frequency of updates
Key Considerations
- A data system dashboard often includes summary or aggregate data on key metrics. A dashboard often provides an overview of a service coordinator’s caseload, with a count of the number of children in various phases of service (e.g., in referral status, eligibility determination, or needing an initial IFSP or annual IFSP review). Such a report might also provide a display of the list of children in each of these status categories, or the list might form the basis of the report with a summary count included. Some or all of the APR indicators could also be featured on a dashboard.
- Notification or tickler systems are used to provide information to users about various tasks coming due. See the Notifications/Alerts feature for more detail information.
Calendaring systems are used to highlight important dates for critical tasks and other events, for example, staff or team meetings, professional development activities, or data system updates. - Message boards are often used to make announcements related to the data system, such as messages on when the system will be down for maintenance.
- All functionality on a dashboard, including any reports, should be developed for specific user roles, such as service coordinator and administrator, as their needs will often be different. For example, service coordinators are more likely to need child-level information whereas administrators may want aggregate information.
- Interactivity, such as filtering, sorting, or drill-down, can be used in a dashboard, but should not be required to identify indicators that are under performing.
- Data displayed on a dashboard should be automatically and regularly updated (at a frequency determined by the organization) without any action required by the user.
- When developing any types of reports, it is important to take into account the complexities that result from children transferring from one local program to another and the resulting impact on timelines, IFSP follow-up dates, etc.
State Examples
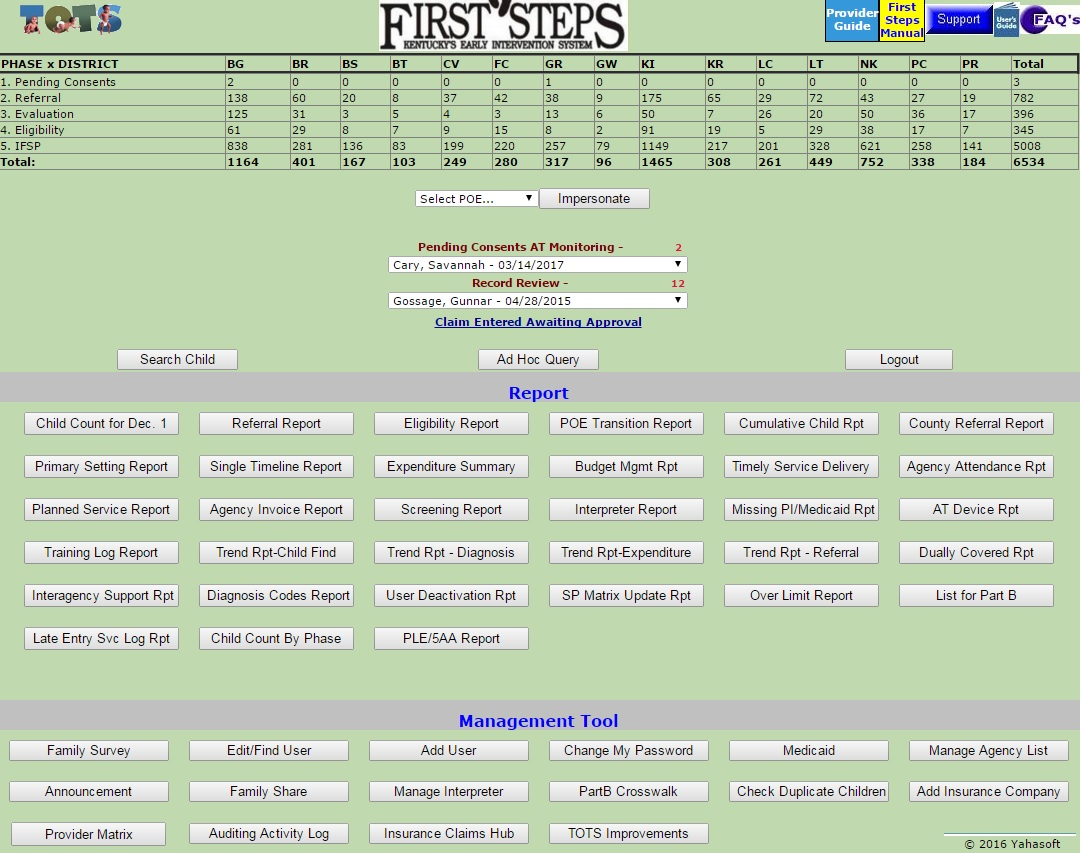
Kentucky
- The screenshot from Kentucky’s Technology-assisted Observation and Tracking System (TOTS) shows the home page with a count of children by phase and district, and a list of reports.
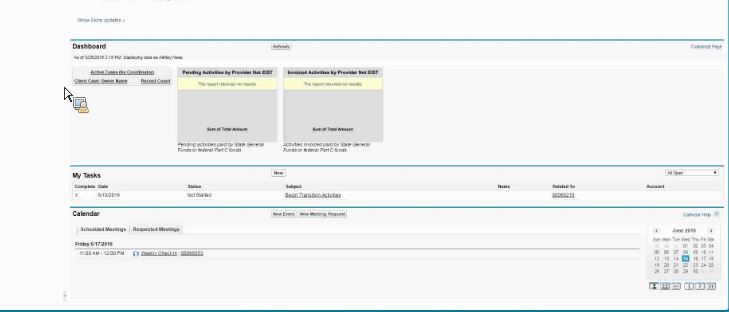
Colorado
- This screenshot displays the system’s dashboard along with tasks and a calendar of events/activities.
Washington
Early Supports for Infants and Toddlers (ESIT) Data Management System (DMS) Replacement Training guide (v1.1) ((see pages 2–6). This document describes the main DMS dashboard, with views of a calendar of tasks and events, lists of children on one’s caseload and the status of each, and system notifications.
Related Resources
- A Guide to Creating Dashboards People Love to Use (Juice Analytics, 2009)
Although not specific to early intervention, this three-part guide provides concepts and best practices to create a high-impact dashboard that people will love to use. - Data Visualization Toolkit: Dashboards (DaSy Center, 2016)
This toolkit is a compilation of resources for creating engaging data displays, as well as tips for effective use. This section of the toolkit provides helpful information on how to incorporate data visualization into the design of dashboards.
Published June 2017.