
- Overview
- Introduction
- Data as information
- IDEA Section 618 data
- SPP/APR
- SSIP
- Data privacy & confidentiality
- Data linkages
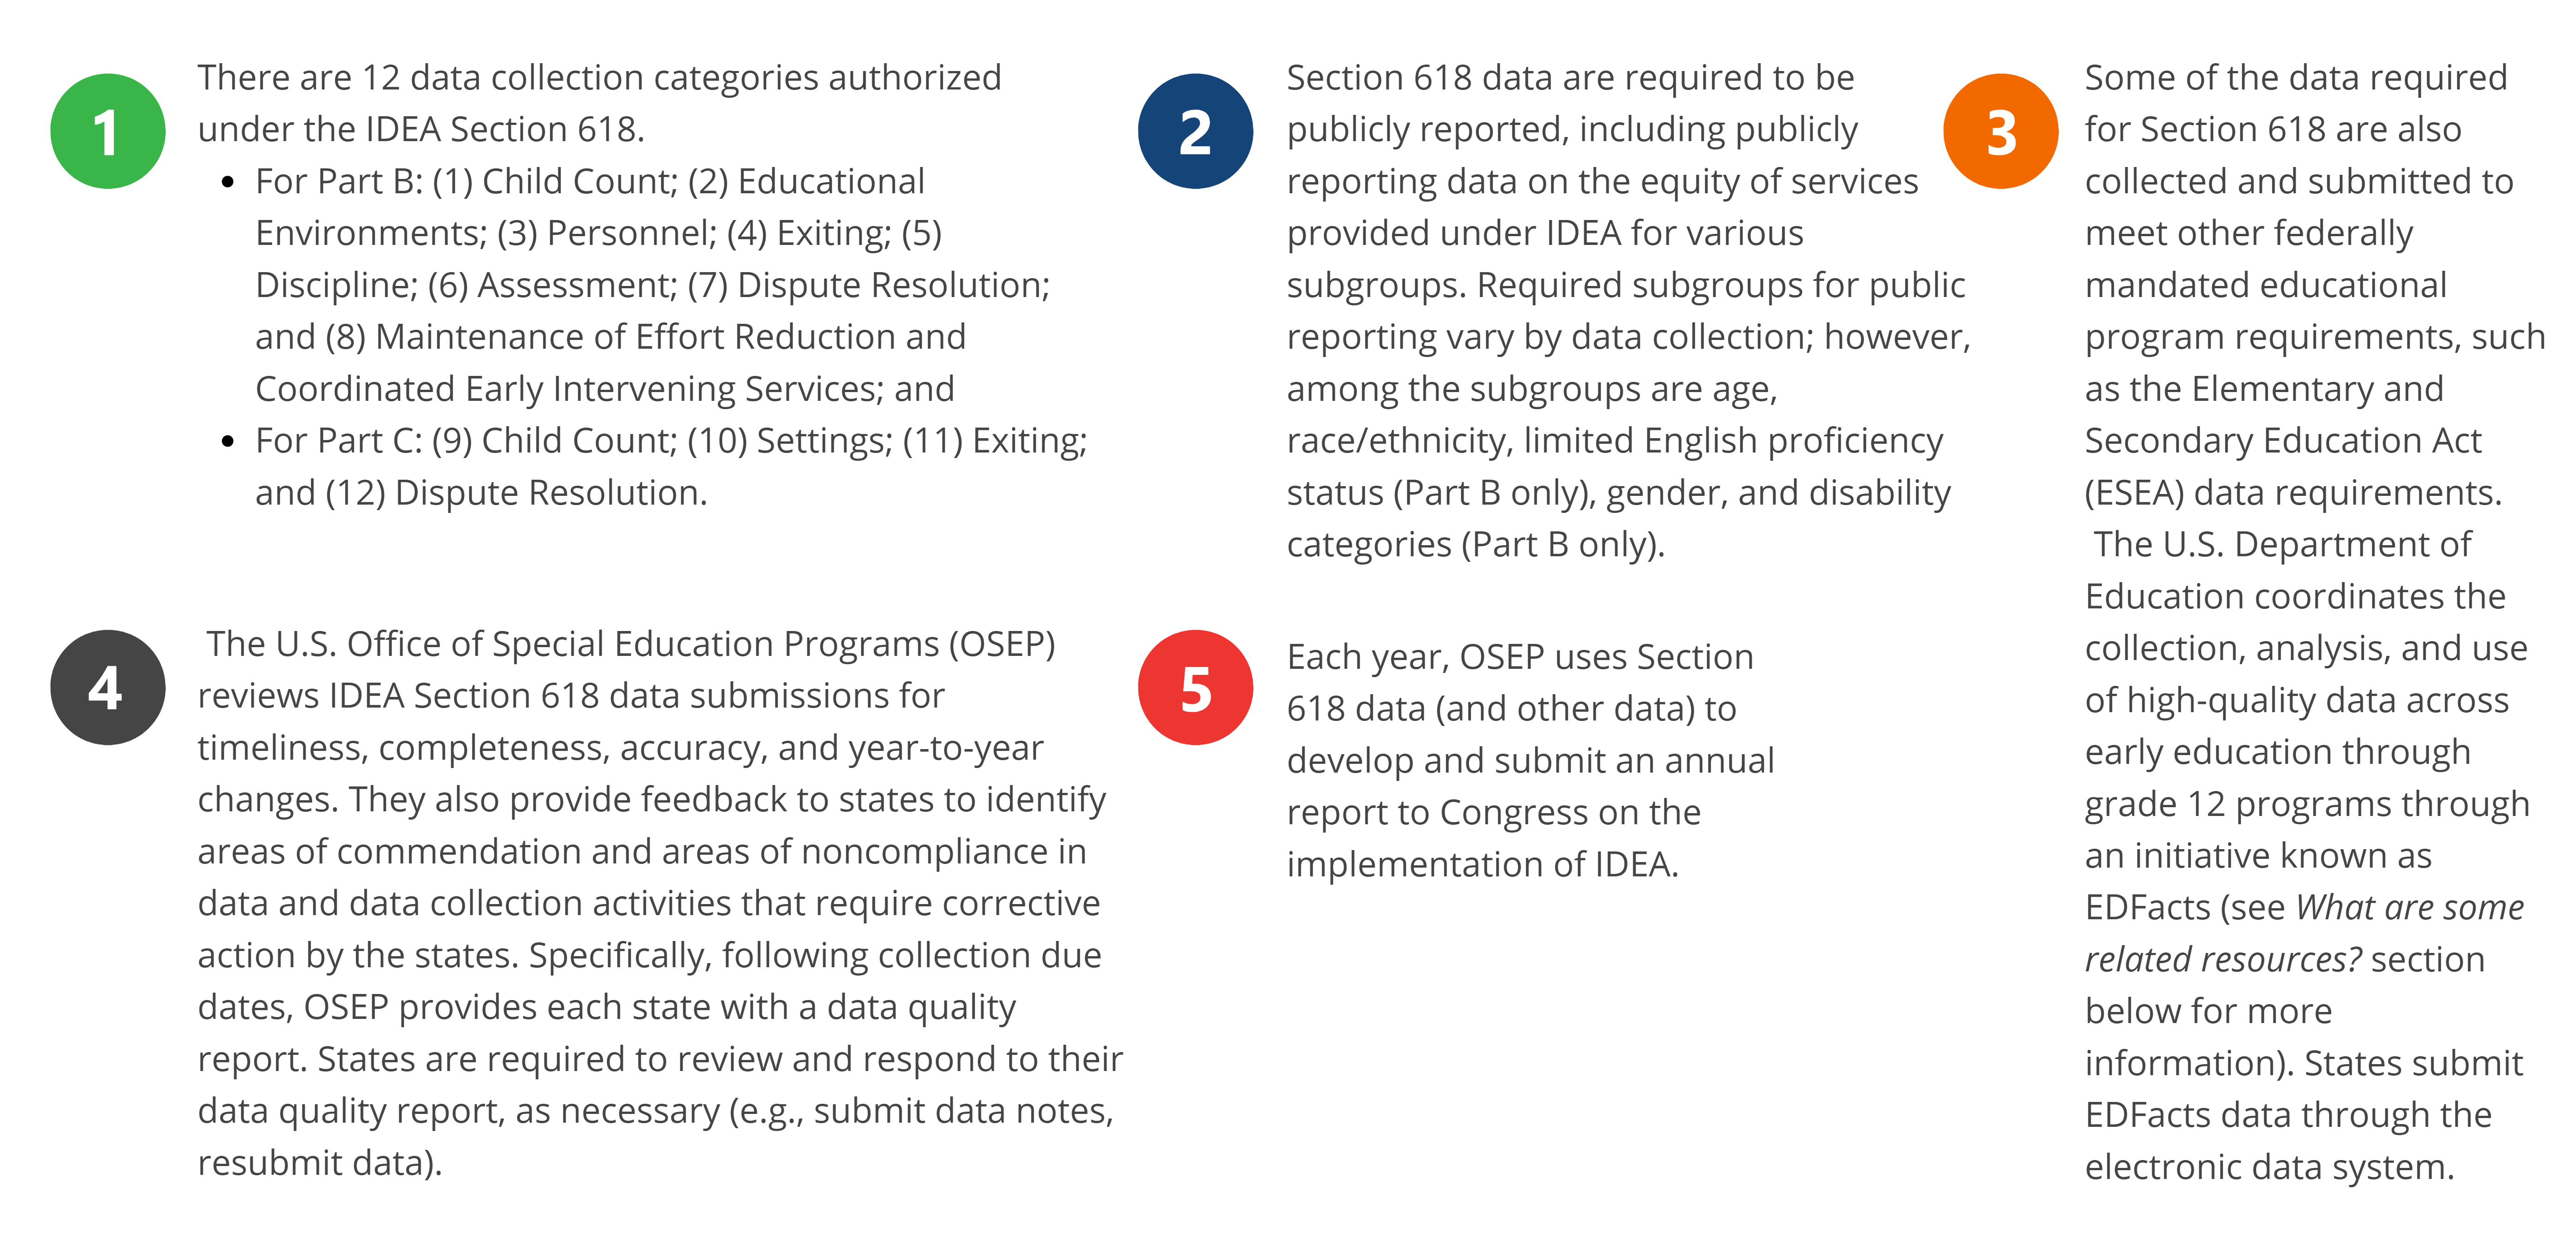
All states and U.S. territories are eligible to receive grant funding to support the implementation of the Individuals with Disabilities Education Act (IDEA). Under Section 618 of IDEA, grantees are required to submit data to show that the law is being carried out in the state, such as the number of children served (i.e., child count). There are a number of required Section 618 data elements on which states must report.
In this section, you will learn about:
- The purpose of IDEA Section 618 data reporting requirements;
- The categories of data on which states are required to report; and
- How Section 618 data are used to examine critical issues in the implementation of IDEA programs.
What do I need to know?
It is important for Part C and Part B 619 systems-level stakeholders to know what data states are required to report under Section 618 of IDEA and how the U.S. Department of Education uses these data.
Download a PDF version of this section.
How do I build my knowledge?
High-quality IDEA data help ensure that children with disabilities receive the early intervention and special education services to which they are entitled. Click on the image below to watch a video developed by the IDEA Data Center to learn more about the history of and evolution of data use in early intervention and special education.
How do I apply this to my state?
Examining your state’s IDEA Section 618 data can help you begin to explore important issues related to the implementation of Part C and Part B 619 programs. OSEP makes the past two years of Section 618 data available to the public in easy-to-use tables.
Practice Reading and Interpreting Data: Services in the Natural and Least Restrictive Environments
One of the core principles of IDEA is that early intervention and special education services be delivered in natural and least restrictive environments to the maximum extent possible, meaning in places where children without disabilities play, learn, and otherwise spend time. This is monitored through the reporting of data on educational environments (for Part B) and early intervention settings (for Part C).
To begin exploring this issue, find your state’s data in one of the following tables in OSEP’s set of IDEA Section 618 Data Products.
- For Part B: Child Count and Education Environments (Table 12) — Number and percent of children ages 3 through 5 served under IDEA by educational environment and state.
- For Part C: Child Count and Settings (Table 7) — Number of infants and toddlers birth through 2 served under IDEA by early intervention setting and state.
Answer the following questions using the reported data:
- In which environment/setting are the majority of services provided? Is this what you would want to see?
- For Part B ages 3 through 5, you want to see the majority of children attending a regular early childhood program at least 10 hours a week and receiving the majority of services in that location.
- For Part C infants and toddlers, you want to see the majority of children receiving services in community-based and/or home settings.
- Were there drops or spikes in the number of children receiving services in a particular environment/setting? If so, seek clarification from state agency staff on why these drops and/or spikes may be occurring.
Talk with state agency staff about the efforts in place to increase opportunities for children with disabilities to participate in environments and settings that are typical for children their age without disabilities. Consider exploring other issues by looking at your state’s Section 618 data, such as the:
- Number and percent of children served by race/ethnicity
- Number and percent of children ages 3 through 5 with limited English proficiency (LEP)
- Number and percent of written, signed complaints initiated through dispute resolution procedures
What are some related resources?
- The U.S. Office of Special Education Programs’ Annual Reports to Congress on the Implementation of IDEA. This site hosts the annual reports from 1995 to present. The annual reports focus on the children and students with disabilities being served under IDEA Part C and Part B, both nationally and at the state level.
- EDFacts Overview. This 2-page resource describes key things to know about EDFacts , a U.S. Department of Education initiative to collect, analyze, report on and promote the use of high-quality prekindergarten through grade 12 education data for planning, policymaking, and management and budget decision-making to improve outcomes for students.